OVERVIEW
April will be remembered for evolving tariff policies and mixed economic data that lead to a wild ride in financial markets. While markets had been given ample forewarning of “Liberation Day,” when President Trump announced reciprocal tariffs on most countries trading with the US, the magnitude of the tariffs announced went beyond what the markets had anticipated, thus continuing the sell-off that had been ongoing since mid-February. The sweeping tariffs would take the average effective rate for all US imports to over 20%, which the US has not experienced since the early 1900s1. One week later, on April 9th, President Trump announced a 90-day delay in the implementation of the reciprocal tariffs and the S&P 500 jumped by almost 10%. Fixed income investors participated in the market gyrations as the U.S. Treasury 10-year yield bottomed on April 4th at 3.86%. It then proceeded to rise to 4.59% on April 11th before closing the month at 4.16%1.
Economic news was mixed as “hard” data such as the March employment numbers (+228,000 new jobs1) exceeded market expectations, while “soft” data like consumer sentiment fell for the fourth straight month. The month ended with inflation-adjusted gross domestic product (GDP) for Q1 2025 coming in at an annualized rate of -0.3%.1 Despite the contraction, consumer spending was up 1.8% and business equipment purchases saw the fastest growth since 20201. The primary cause for the negative GDP was net exports subtracting nearly 5% from GDP1, the most on record, as businesses added to their inventories and consumers increased their purchases prior to the imposition of tariffs.
By the month’s end, exhausted financial market participants, in general, saw changes in their portfolios that did not resemble the chaos they had witnessed in the past thirty days.
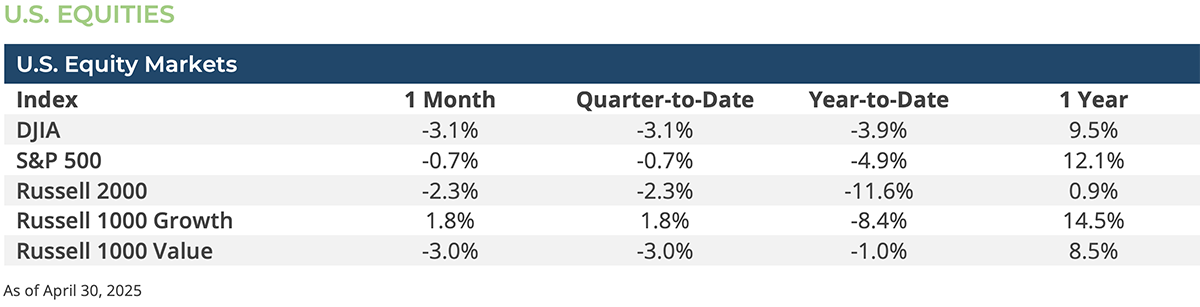
US equities experienced large shifts in momentum, volatility, and sentiment, but, despite the whipsawing of markets due to evolving tariff policies, ended the month close to where they started. In the aftermath of Trump’s tariff announcements on April 2nd equity markets sold off sharply. On April 8th the S&P 500 closed down over 11% from the end of March and the next day declined even further early in the day—taking the S&P 500 briefly into bear market territory—but the Trump administration announced a 90-day pause to most tariffs in the afternoon on April 9th and the S&P 500 closed over 9.5% higher by end of the day. As the Trump administration announced progress on various bilateral trade talks, equities gained more ground. In the end, the S&P 500 lost only 0.7% for the month, while the tech-heavy NASDAQ gained 0.9%.
Despite a mixed Q1 earnings season thus far, and many companies pulling guidance given the evolving tariff landscape, several sectors managed to make gains in April, including IT, Consumer Staples, and Communication Services. Conversely, the Energy sector—weighed down by falling oil prices as expectations for global growth erode—declined -13.7% during month. There was little difference between large cap and mid-cap stocks in April—Russell 1000 -0.6% vs Russell Midcap Index -1.0%—but small caps (Russell 2000 Index) declined by -2.3%. Growth stocks (Russell 1000 Growth Index +1.8%) far outpaced their Value peers (Russell Value Index -3.1%).
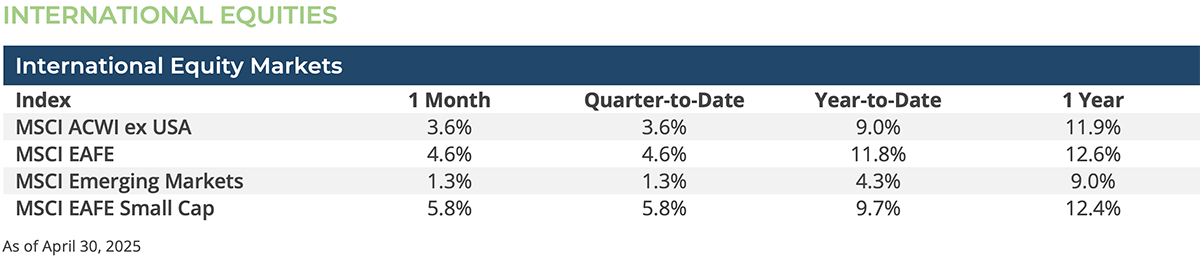
International equities generally fared better than US equities in April, but much of this outperformance was due to weakness in the US dollar which boosts the relative returns of non-US equities. The MSCI EAFE Index gained 4.6% in dollar terms, but in local currency it was negative (-0.1%) for the month. Emerging market equities (MSCI EM Index) gained 1.3% in April, and like developed international equities, all those gains came from the decline in the US dollar. Unlike in the US, however, international small caps (MSCI ACWI ex US Small Cap Index +4.7%) outpaced their large cap peers (MSCI ACWI ex US +3.6%). Many non-US equity markets were negatively impacted by the evolving US tariff policy including China, which saw its equities (MSCI China Index -4.3%) decline in April as many Chinese exporters face cancelled orders.
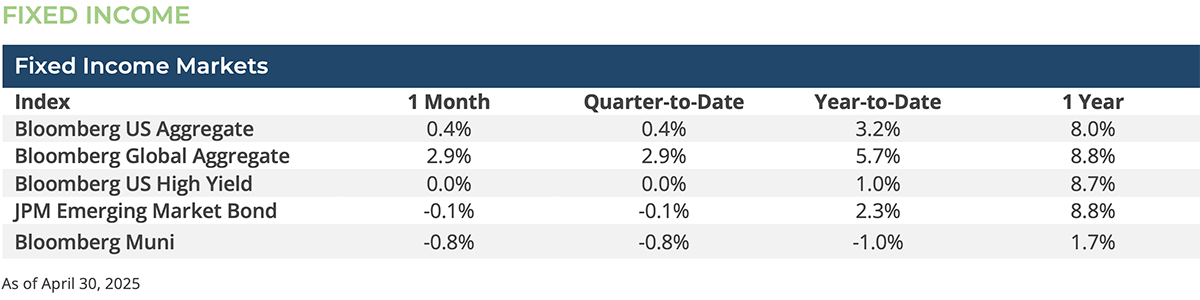
Given all the equity market chaos witnessed throughout the month, it shouldn’t be a surprise that U.S. Treasury securities (Bloomberg U.S. Treasury index, +0.63%) outperformed both U.S. Investment Grade Corporates (Bloomberg Corporate Investment Grade index, -0.03%) and the U.S. High Yield Corporates (Bloomberg U.S. Corporate High Yield index, -0.02%). Although corporate bonds underperformed, we are not seeing signs of panic selling that often coincides with significant equity market drawdowns.
The significant move in interest rates occurred in the 2 – 5-year maturity range which declined over 20 bps, while 30-year yields increased 9 bps. As such, long maturity securities delivered negative returns (Bloomberg 10+ Year index, -1.00%) while shorter maturities delivered solid returns (e.g., Bloomberg 1-3 Year index, +0.74%).
CONCLUSION & OUTLOOK
The Federal Reserve has emphasized the resiliency of the labor market and, thus far, the stability in consumer spending. Parts of the market, on the other hand, are increasingly pricing in a higher probability that the United States will enter a recession by year-end and are betting that the Fed will lower the Fed Funds rate nearly four times over the remaining eight months. While several Fed speakers acknowledged that sentiment indicators for both businesses and households had noticeably weakened, they did not yet see clear signs of spending pullback and they reiterated their caution as the impact of the new tariff policies work through the economy.1
As we have repeatedly said, the markets will remain volatile as investors seek clarity in an environment that reacts (and overreacts) to any given “tweet.”
[1] Bloomberg LP
DISCLOSURES: Information provided in this article is general in nature, is provided for informational purposes only, and should not be construed as investment advice. The views expressed by the author are based upon the data available at the time the article was written. Any such views are subject to change at any time based on market or other conditions. Clearstead disclaims any liability for any direct or incidental loss incurred by applying any of the information in this article. All investment decisions must be evaluated as to whether it is consistent with your investment objectives, risk tolerance, and financial situation. The performance data shown represent past performance. Past performance is not an indicator of future results. Current performance data may be lower or higher than the performance data presented.