OBSERVATIONS
- Markets traded higher last week as Q1 earnings season improved—see Expectations. The S&P 500 gained 2.9% and small caps (Russell 2000) gained 3.2%, while the yield on the 10-year Treasury ended the week higher by 7 basis points at 4.31%.[1]
- The initial estimate for Q1 GDP shows that the economy shrank by -0.3% in the quarter in large part due to a surge of imports which detracted from the GDP calculation. Final sales to domestic purchasers, which removes both net exports and changes in inventories, showed healthy growth of 2.3% for Q1, however personal consumption grew only 1.8%, which was the lowest in nearly two years.[1]
- The manufacturing PMI showed that the manufacturing sector remains weak following 48.7 in April, down from March’s 49.0 level—any figure below 50 denotes contracting activity—however analysts were expecting a deeper decline given the substantial increase in average US tariff levels earlier in the month.[1]
- The Fed’s preferred inflation gauge core-PCE—which removes volatile food and energy prices—came in largely as expected and showed that inflation eased in March to 2.6% year-over-year (YoY) down from February’s rate of 3.0% YoY. Headline PCE showed that all prices (including food and energy) increased by 2.3% YoY down from February’s 2.7% YoY figure.[1]
- Job postings moved lower in March (latest available) to 7.192 million open jobs, which was below expectations and 288k fewer job openings than in February.[1]
- Initial unemployment claims showed the first signs of weakness this year, jumping last week by 18k to 241k new initial claims. On a non-seasonally adjusted basis, initial claims moved higher last week at a time of the year when initial unemployment claims typically move lower.[1]
- However, the economy created 177k new jobs in April, which was above expectations and the unemployment rate held steady at 4.2% and labor force participation inched up to 62.6%.[1]
EXPECTATIONS
- About 72% of the S&P 500 have reported Q1 earnings and this earnings season got a boost last week with several large tech names beating estimates, particularly Microsoft and Meta. Thus far, 76% of firms reporting have beaten estimates, which is ahead of the 10-year average (75%) but behind the 5-year average (77%), while the blended earnings growth rate for Q1 earnings currently stands at 12.8% YoY.[2]
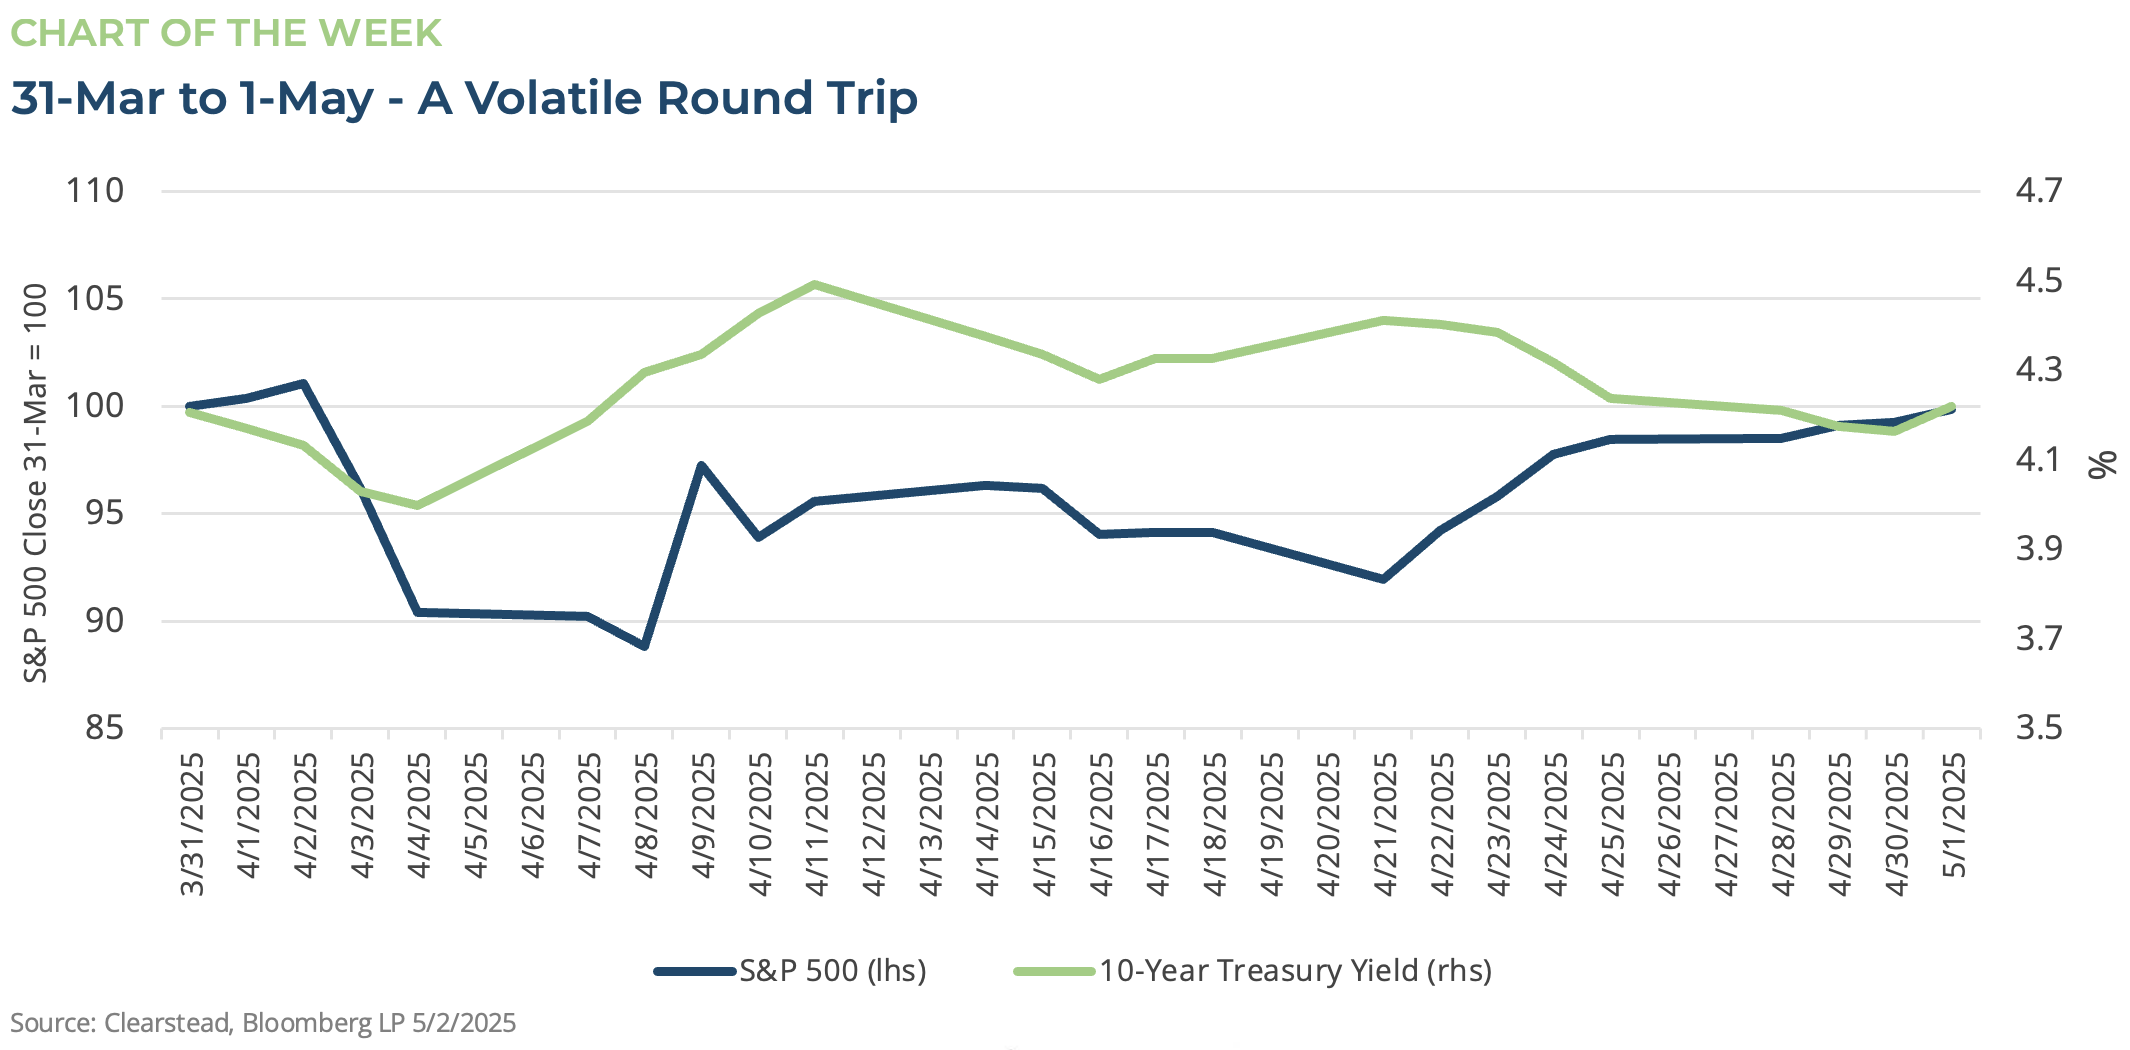
ONE MORE THOUGHT: Lots of Volatility to Go No Where – If April only had One More Day[1]
April was full of surprises and volatility. As markets closed on March 31st the S&P 500 stood at 5,611 and the yield on a 10-year Treasury was 4.21%. Then came Liberation Day and the Trump administration announced the largest increase in tariffs in over 100 years. Equities sank and trading turmoil gripped the US Treasury market. On April 8th the S&P 500 closed down over 10% lower than it started the month, while the yield on a 10-year Treasury—which just days before had fallen below 4.0%—had risen to 4.3%. However, the next day the Trump administration announced a 90-day pause on most tariffs, excluding those levied at China, and equity markets rebounded, but the yield on the 10-year continued to drift higher, eventually closing around 4.5% on April 11th. At this point, both the VIX— a measure of equity volatility and so called “Fear Gauge“—and the MOVE—the bond market equivalent of the VIX—were at highly elevated levels. However, calm slowly returned to the market. First, the Trump administration began to signal more flexibility than perhaps initially conveyed as it came to the US’s evolving tariff policy with most US trading partners. Second, some of the margin calls and hedge fund trades impacting the bond market (see RC 14-Apr) began to subside. Lastly, the Trump administration signaled a willingness to deescalate its tariff war with China and set the stage for eventual talks with the second-largest global economy. As the month ended, equity volatility declined, and stocks nearly recovered to where they began the month. If April had one more day, then it would have marked the first time the S&P 500 declined more than 10% and then gained it all back in the same month. As it stands, the S&P 500 did just that on May 1st. Similarly, bond market volatility eased over the past few weeks and the yield on the 10-year Treasury closed May 1st almost unchanged from its close on March 31st. The 90-day tariff pause is not a permanent solution to what roiled markets in April. Bilateral trade deals need to progress, permanent tariff levels need to be announced, and only time will tell if the US labor market can remain resilient in the face of rapidly changing global supply chains. Markets will remain volatile until clarity on these issues emerge, but so long as the can is kicked down the road—April’s sideways market is likely to continue over the coming weeks and months.

[1] Bloomberg LP, 5/2/2025
[2] FactSet Earnings Insight 5/2/2025
DISCLOSURES: Information provided in this article is general in nature, is provided for informational purposes only, and should not be construed as investment advice. These materials do not constitute an offer or recommendation to buy or sell securities. The views expressed by the author are based upon the data available at the time the article was written. Any such views are subject to change at any time based on market or other conditions. Clearstead disclaims any liability for any direct or incidental loss incurred by applying any of the information in this article. All investment decisions must be evaluated as to whether it is consistent with your investment objectives, risk tolerance, and financial situation. You should consult with an investment professional before making any investment decision. Performance data shown represents past performance. Past performance is not an indicator of future results. Current performance data may be lower or higher than the performance data presented. Performance data is represented by indices, which cannot be invested in directly.
Related or Tagged New Posts
market perspectives
April 28th 2025
Research Corner | 4/28/2025
market perspectives
April 21st 2025
Research Corner | 4/21/2025
market perspectives
April 14th 2025
Research Corner | 4/14/2025

market perspectives
April 8th 2025
Quarterly Market Insights | 1Q25
market perspectives
April 7th 2025
Research Corner | 4/7/2025
market perspectives
March 31st 2025
Research Corner - 3/31/2025
market perspectives
March 24th 2025
Research Corner - 3/24/2025
market perspectives
March 17th 2025
Research Corner - 3/17/2025

market perspectives
March 10th 2025
Research Corner - 3/10/2025
market perspectives
March 7th 2025
Market Update - March 7, 2025
market perspectives
February 17th 2025
Research Corner - 2/17/2025
market perspectives
January 7th 2025
Quarterly Market Insights - 4Q24