
Capturing Income and Diversification Outside the Index Box
Benchmarks are designed to measure markets, not design portfolios. In fixed income, that distinction matters more than ever, because using a benchmark as a blueprint can introduce unintended risks and lead to weaker portfolio outcomes.
The Bloomberg U.S. Aggregate Bond Index (“Agg”) remains a useful yardstick and reasonable starting point for core bond portfolio design, but most investors need a more intentional approach today. As the index has shifted toward more government debt, longer duration, and narrower market coverage, it has become less aligned with how investors typically want core fixed income to function in portfolios.
This paper explains how the Agg evolved, why those changes matter for portfolio outcomes, and how a more purpose-driven, disaggregated framework can improve fixed income portfolio design.
To understand why the Agg’s role has changed, it helps to start with how it was originally designed.
Historical Evolution of U.S. Bond Indices
In 1973, Art Lipson and John Roundtree created two total return indexes focused on U.S. bonds: the U.S. Government and the U.S. Investment Grade Corporate Indexes. The indexes were blended in 1979 to form the Government/Credit Index. In 1986, mortgage-backed securities were also added to the index, which was renamed the U.S. Aggregate Index and backfilled with historical data to 1976.[1] The index has had various owners – Kuhn, Loeb & Co., Lehman Brothers, Barclays, Bloomberg – and, since August 2021, the index has been known as the Bloomberg U.S. Aggregate Bond Index.[2]
The Agg was created to be a broad base benchmark for the investment-grade, taxable, fixed-rate U.S. bond market, representing a broad mix of U.S. Treasuries, government-related debt, corporate bonds, and mortgage/asset-backed securities. Like the S&P 500 Index is for stock investors, the Agg is a standard measure for tracking the U.S. fixed income market. But there are major structural differences between the composition of the Agg and the S&P 500. The S&P is market capitalization weighted: Total market cap = Sum of each company in the index’s float share count multiplied by the price per share of the stock; a company’s weight in the index increases as the stock price increases. While the Agg is also a market capitalization weighted index, the number of “shares” is not fixed; as such, by simply issuing more debt a company/government entity’s weight in the Agg will increase. Additionally, while the S&P 500 represents roughly 80% of the total market value (capitalization) of all U.S. public companies, the Agg represents less than half of the U.S. fixed-income universe. An investor who purchases a passive Agg index fund could end up owning poorly performing, highly indebted entities, while ignoring well run organizations, with little debt, not represented in the Agg.
How has the Aggregate Index changed?
Over the past twenty-five years, the characteristics and the risk profile of the Agg have significantly changed.
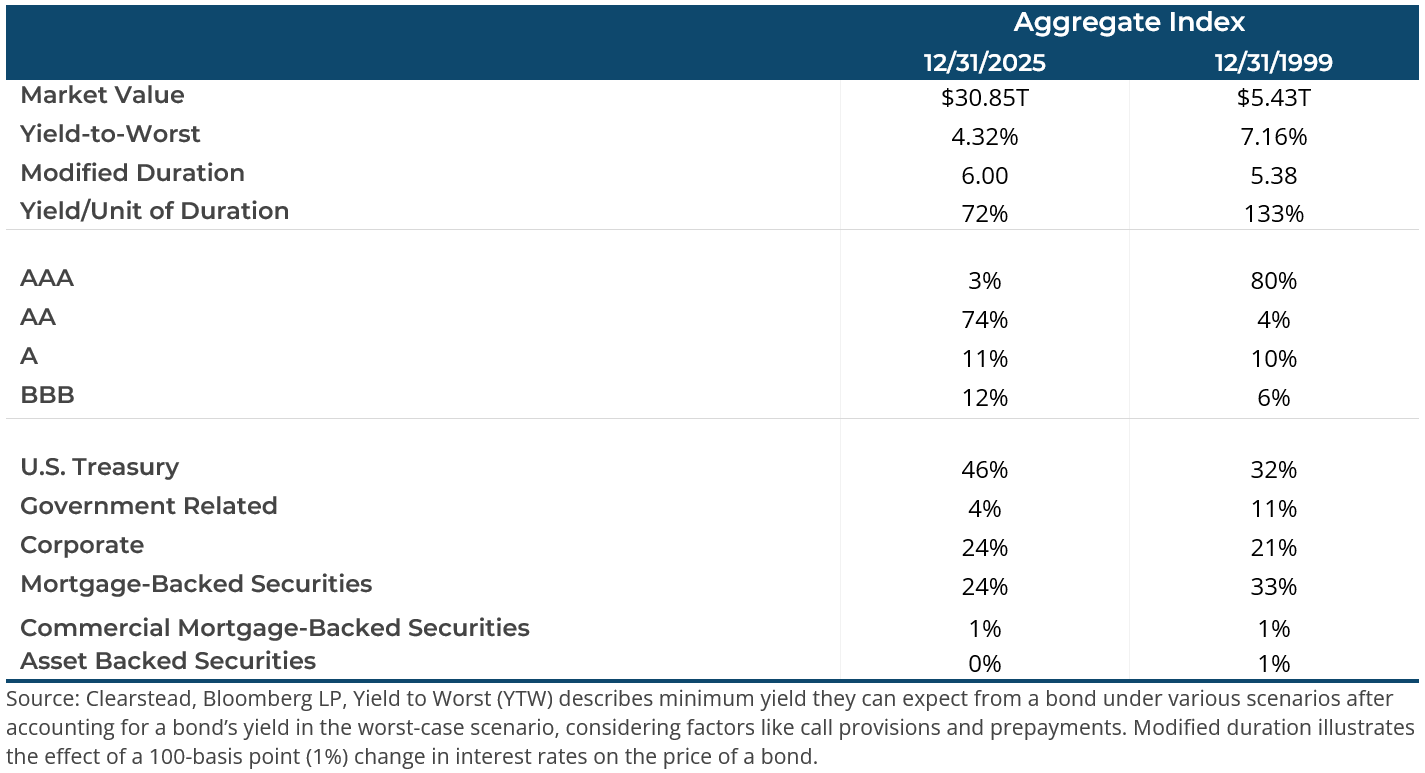
The market value of the Agg has grown by almost 6X in the last 25 years, predominantly due to the increase in U.S. Treasury debt funding the ever-increasing U.S. government budget deficit.
While yields have decreased, the duration of the index has increased, resulting in an index that is much more sensitive to the changes in interest rates.
Due to the U.S. government’s credit rating being downgraded from “AAA” to “AA”, the Agg’s credit profile has diminished. Also, Corporate America’s credit profile has declined, and “BBB” rated corporate securities now represent close to 50% of the investment grade corporate index.
In the last 25 years, U.S. Treasury representation has grown from 32% to 46% and will likely increase in an era of trillion-dollar budget deficits that must be funded via the sale of U.S. Treasury securities.
So, the index being used to measure fixed income performance is generating lower yields from a less credit worthy profile, is more sensitive to changes in interest rates, and has a future that will be dominated by lower yielding U.S. Treasury debt. That is a rather low bar to set as a standard for success.
Why the Agg Is Increasingly Viewed as “Broken”?
Core fixed income has historically served a clear role in portfolios: generating income, providing diversification, and helping preserve capital in periods of stress. The reason the Agg is increasingly viewed as “broken” is not that it fails to measure, but that its default exposures can be misaligned from what investors typically want core fixed income to deliver.
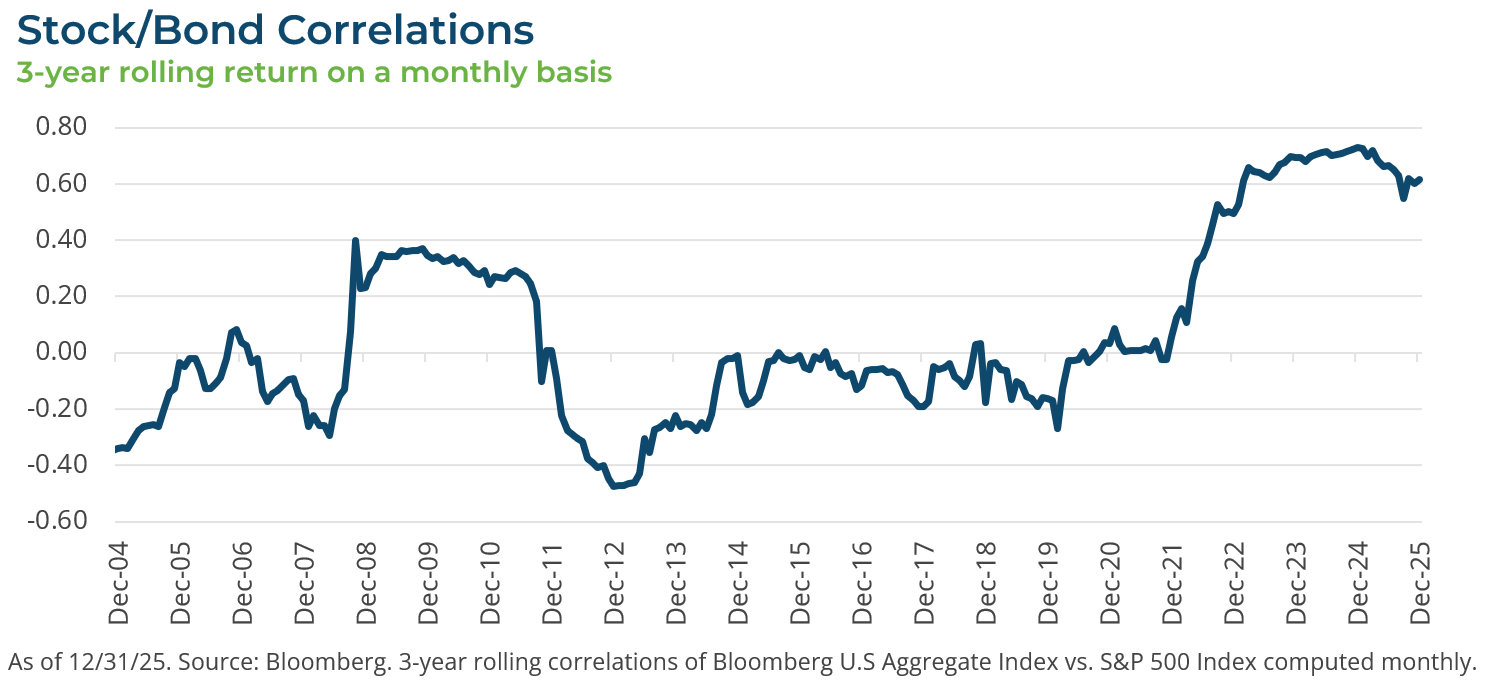
In the Great Financial Crisis (GFC) era, near-zero interest rate policy and Quantitative Easing helped drive yields to historic lows alongside unprecedented levels in government borrowing. Many corporations also extended maturities to lock in cheap financing. As a market weighted index, the Agg absorbed more of that issuance over time and extended in duration, leaving it more interest-rate sensitive, with less yield to cushion volatility. The vulnerability was exposed in 2022, when the Agg declined by roughly 13%, its worst calendar-year result on record.[3] And while investors have long relied on core bonds to act as a portfolio ballast during equity drawdowns, 2022 also marked an inflection point for diversification as equities declined by 18%.[3] The chart below shows stock–bond correlations moving higher coming out of that period.
At the same time, the Agg’s eligibility rules exclude meaningful segments of the broader fixed income opportunity set. Taken together, these shifts help explain why many investors are rethinking what “core fixed income” should look like in portfolio construction today.
Why has the Agg underperformed since the GFC?
The post-GFC period marks a clear shift in how the Agg has behaved relative to active managers. The Agg has gone from rarely trailing the median core bond manager to doing so about half the time. On three-year rolling returns, the Agg has been behind the median active core bond manager about 53% of the time after mid-2009, versus only 4% in the pre-GFC period (1989–mid-2009).[4]
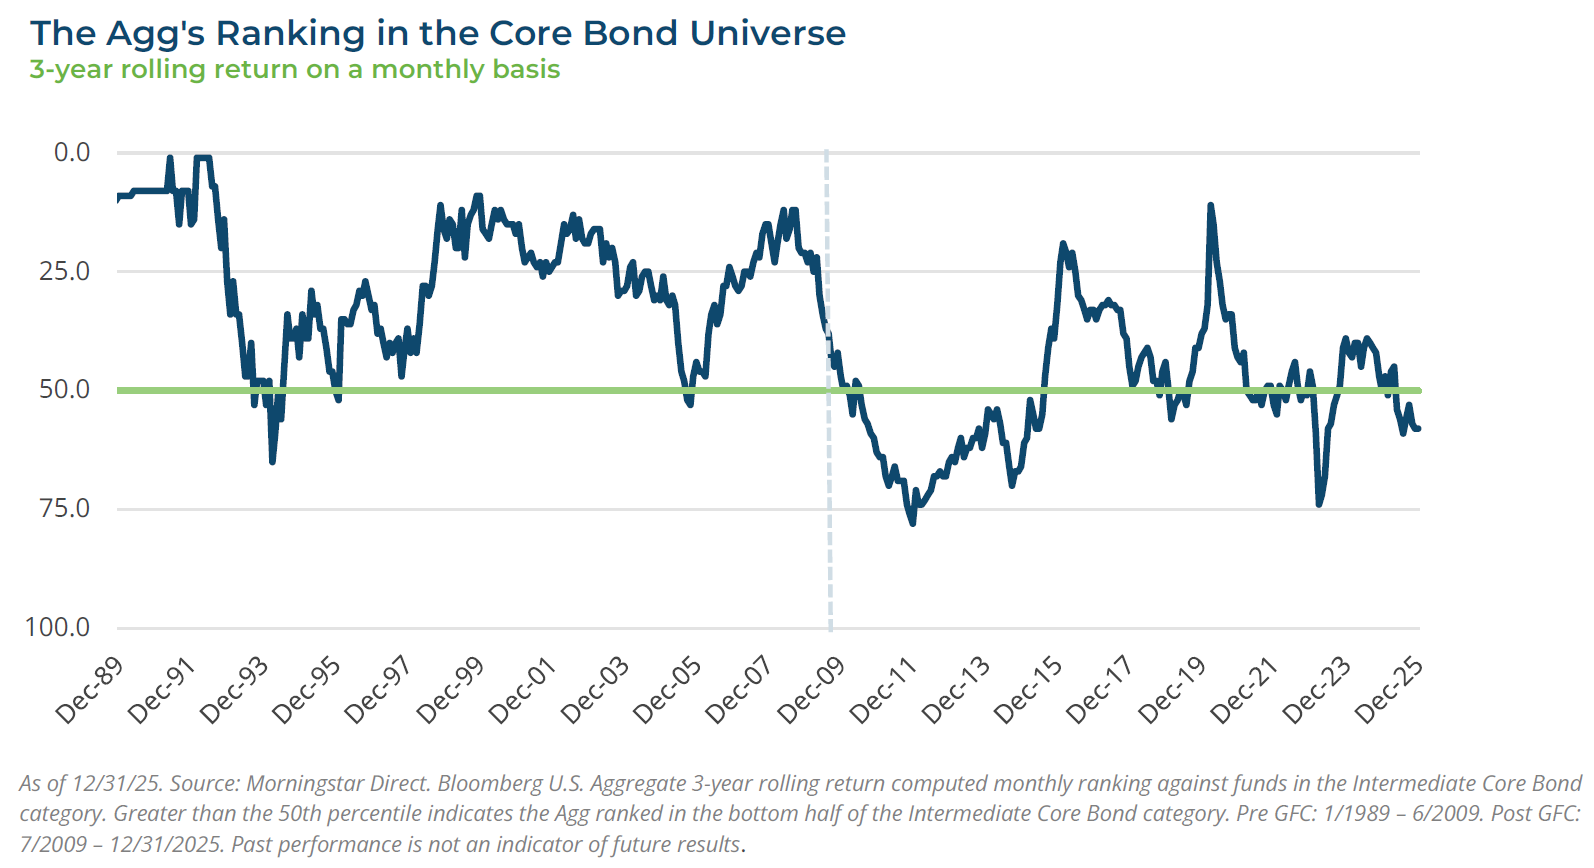
One reason this gap widened is that the benchmark’s evolution increased the impact of portfolio construction choices. With more duration and less carry embedded in the index, relatively small differences in duration posture, curve positioning, and sector allocation have tended to matter more for results over full cycles.
Another factor is the opportunity set beyond the index. Of the roughly $58 trillion U.S. public bond market, approximately 48% is not represented in the Agg, including meaningful segments of securitized credit and entire markets such as high yield bonds and leveraged loans. Selective exposure to these areas can enhance carry and diversify return drivers, while reducing reliance on the interest-rate-sensitive segments that dominate the benchmark.
What is missing from the Aggregate Index?
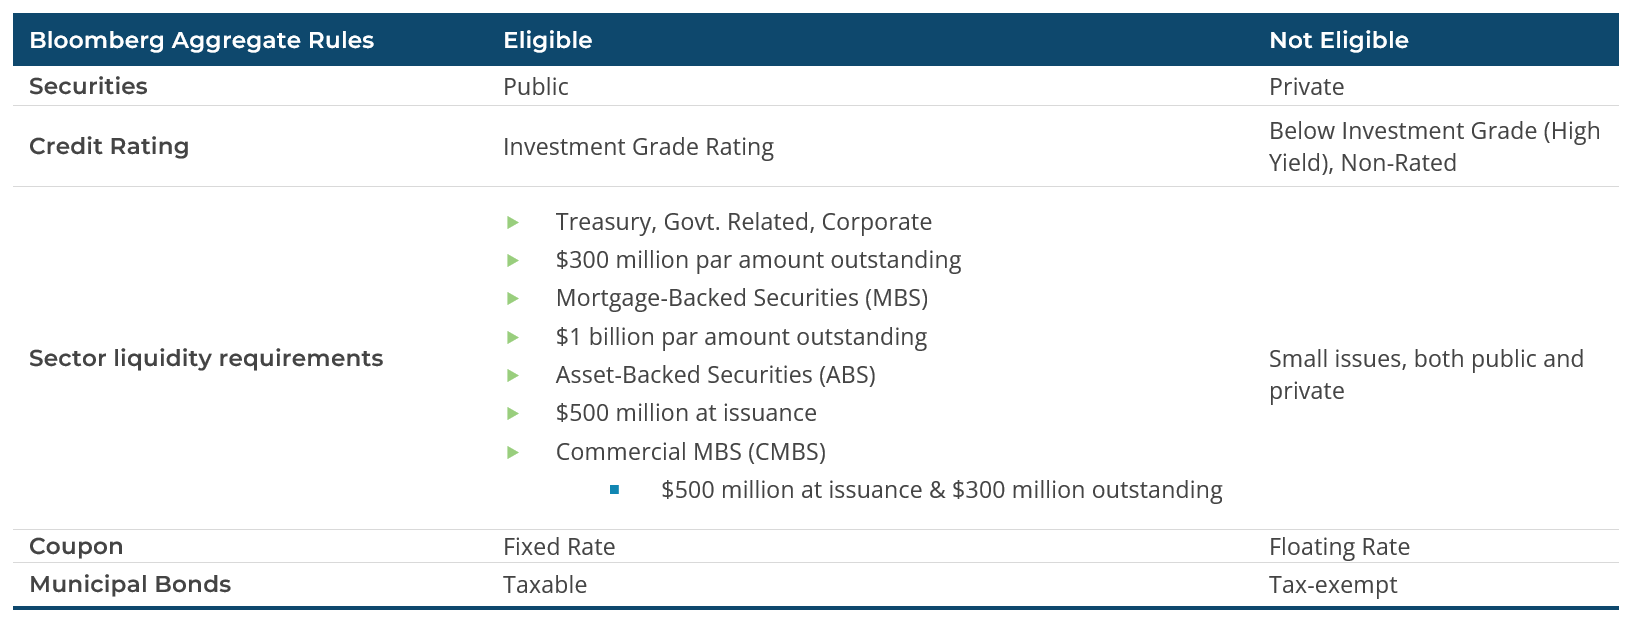
As previously stated, the Agg represents less than half of the U.S. fixed-income universe. The Agg’s eligibility requirements are very specific and, by default, eliminate large markets of actively traded fixed income investment opportunities. These exclusions limit investors’ access to yield, diversification, and potential alpha.
When limiting the opportunity set to just those eligible for inclusion in the Agg, investors are not only missing out on attractive investments but also stifling their ability to achieve their financial goals.
High yield securities, when accessed via actively-managed and well-diversified funds, can minimize some of the drawbacks of today’s Agg. The Bloomberg High Yield Index, as of 12/31/2025, had a yield-to-worst of 6.53%, a modified duration of 3.01, thus a yield/unit of duration of 2.17.[5] Relative to the Agg, the High Yield Index out yields and is significantly less interest rate sensitive than the Agg. Interestingly, while the Agg’s credit profile has deteriorated since 1999, the High Yield Index’s credit profile has improved.
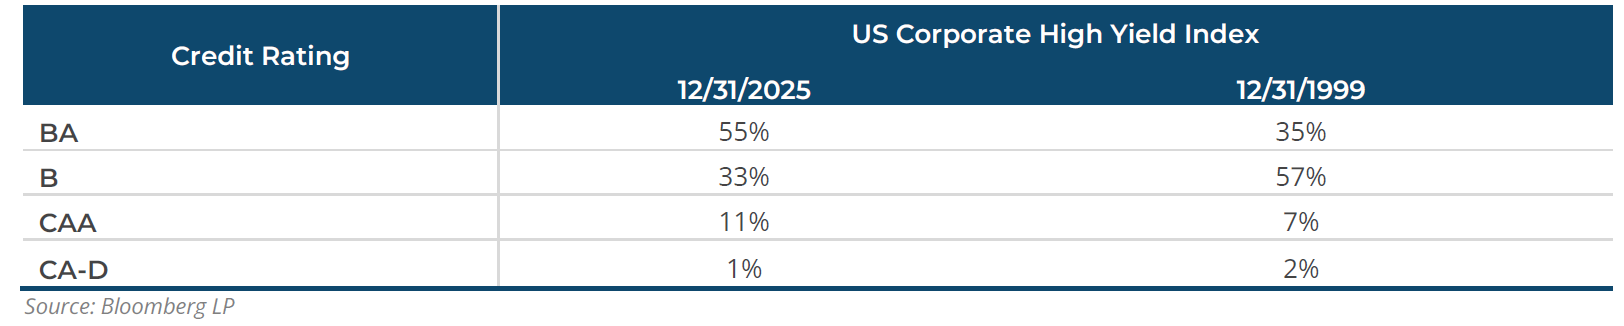
Not surprisingly, since 12/31/1999, the Bloomberg U.S. Corporate High Yield Index has outperformed the Agg (6.62% vs. 4.06%, annualized, as of 12/31/2025).[6] This time period includes such market upheavals as the Dot-Com Crash (Early 2000 – Late 2002), the GFC (late 2007 – mid-2009), and the Covid crash in 2020. Long-term investors were rewarded for their patience and not panicking during periods of financial market turmoil.
At almost one trillion dollars, there is considerable depth across the asset-backed securities (ABS) market where auto loans, credit cards, and student loans are common collateral types. But due to the eligibility requirements for inclusion in the Agg, only about 10% of the ABS market is represented in the Agg index. ABS offer attractive yields along with a relatively lower duration, reducing the price sensitivity to interest rate moves in the market.
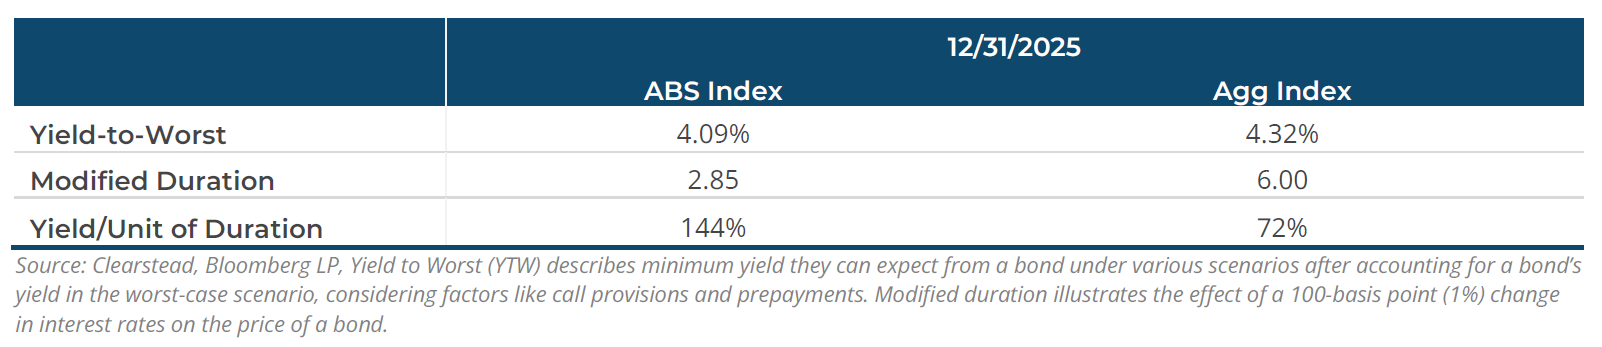
ABS also exhibit strong credit ratings, with more than half of all U.S. ABS carrying the AAA credit rating. This compares favorably to the corporate investment-grade bond market, which includes only two companies (Johnson & Johnson and Microsoft) that are rated AAA.[7] While representing less than 1% of the Agg, asset-backed securities offer investors the opportunity to invest in highly rated fixed income assets with attractive yields and less sensitivity to interest rate movements.
Traditionally, banks have been the primary source of funding for corporate loans. As banks tightened the lending standards of loan portfolios, small and medium-sized businesses still needed funding for their operations. While the demand from Corporate America for debt financing remains robust and banks have declined as a source of capital, private market lenders have stepped in to fill the void as a source of capital.
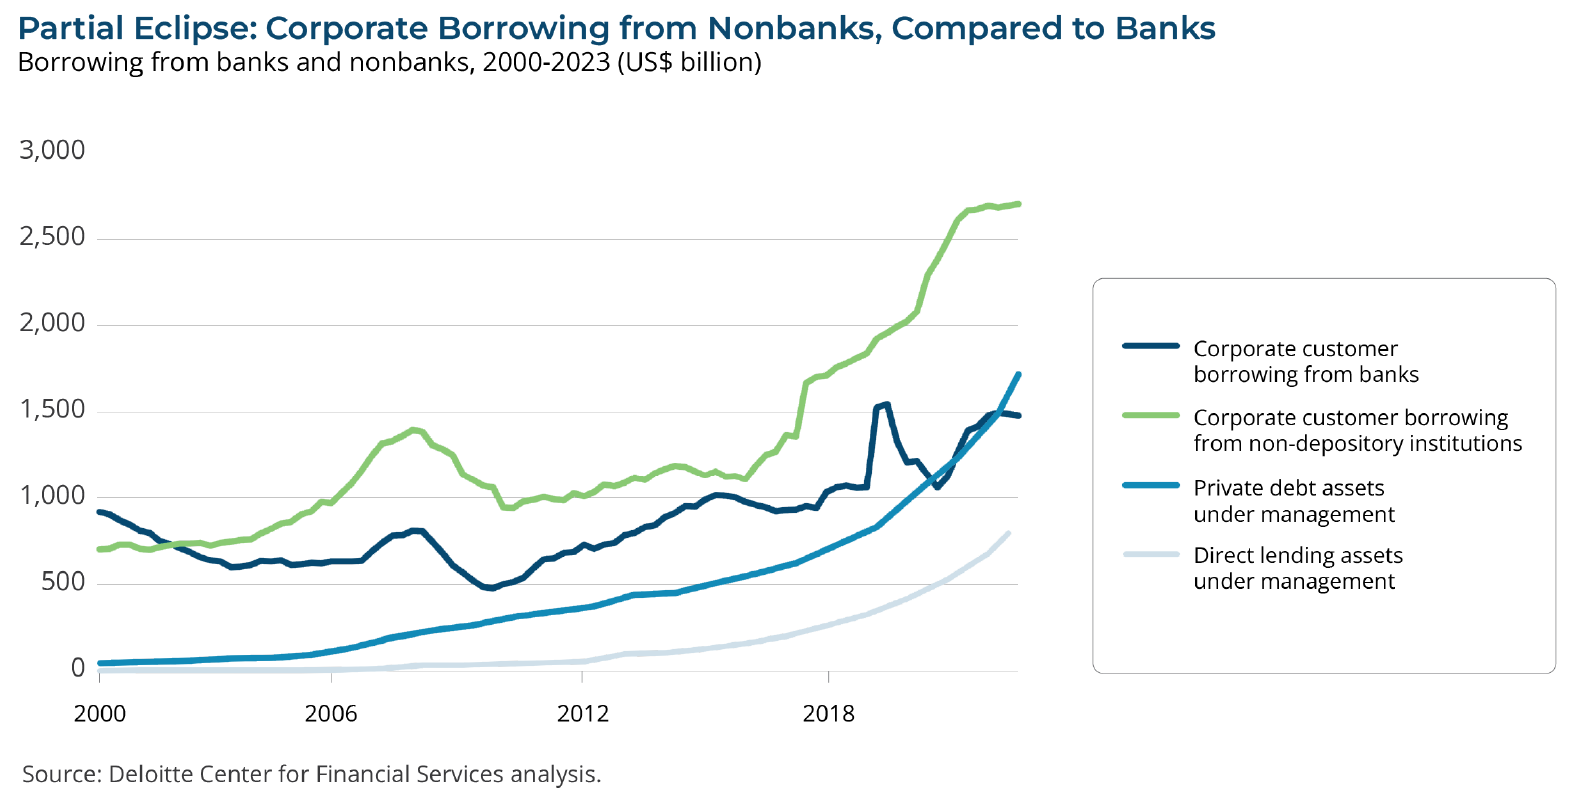
With banks stepping back from leveraged lending, private direct lending has grown rapidly – today global AUM is estimated to be between $2.0 – $2.5 trillion, quadrupling over the previous 10 years,[8] and is forecast to climb further to $2.8 trillion by 2028[9] (almost equal in size to the high yield bond market and the broadly syndicated loan market).
Private credit loans often pay more than public loans of comparable credit quality (i.e., high yield and broadly syndicated loans), sometimes yielding 2% to 4% more. That’s largely because they’re less liquid, you can’t buy and sell them every day. Since the loans are privately negotiated, lenders can build in stronger protections—such as financial covenants, collateral, and reporting requirements—that can help reduce losses in the event of a default. Most direct loans have floating interest rates (i.e., they adjust periodically) which can help protect portfolios when rates rise, unlike most traditional bonds with fixed coupons. Investors are compensated for taking on less liquid investments with higher yields, enhanced protections and because private loans are not priced every day, they tend to avoid the daily volatility you often see in public markets. Private direct lending is becoming a core part of many investor portfolios.
The Modern Approach: Deconstructing the Aggregate Index
Fixed income investments are designed to generate interest income. Unfortunately, over the past quarter century the Agg has transformed from an income-producing machine whose role was to provide stability for an investor’s portfolio, to a volatile, underwhelming income tool, more correlated to equities, thus weakening its ballast character.[10] In order to achieve the purpose of fixed income investing, in today’s environment one must look beyond a core mandate focused on the Agg. One such strategy is to disaggregate the Agg.
Disaggregating the Agg means breaking down the index into its individual components to understand underlying drivers and to reallocate a portfolio’s fixed income exposure to better align with the purpose of fixed income in an investor’s total portfolio. Investors can split the market-weighted index into its parts (government, corporate, MBS) and add non-index investments to build portfolios reflecting specific risk/return goals, rather than accepting the index’s default composition.
Instead of a fixed income allocation being dominated by low yielding U.S. Treasuries, investors can construct portfolios that can enhance a portfolio’s income generation and lower the portfolio’s sensitivity to interest rate volatility. The portfolio’s U.S. Treasury allocation may be achieved via passive investing along different parts of the yield curve. Instead of a passive position of owning all the investment grade corporate bonds in the index, active management could be employed to find the best relative value amongst investment grade, high yield, and private credit opportunities. Short duration, non-index, “AAA” rated, securitized bonds can be used instead of low yielding U.S. Agency debt. Investments like private credit do require investors to accept some liquidity limitations, but the entire fixed income allocation need not have 100% same/next day liquidity. The opportunity set is wide ranging, and the outcome has improved because a bond’s income stream (coupon) is a known data point while its total return is unknown and volatile.
Thinking outside the Agg box combined with skillful portfolio construction can help an investor fulfill the income purpose of fixed income investing.
[1] ”Bloomberg Barclays Methodology”, Bloomberg Professional Services. July 10, 2019
[2] “‘The Agg’ Is Getting a New Name—Again. Bloomberg Has Bigger Plans for Its Index Business”. Barron’s. August 24, 2021
[3] Bloomberg, Bloomberg U.S. Aggregate Bond Index & S&P 500 calendar year returns.
[4] Morningstar Direct, Bloomberg U.S. Aggregate TR Index. Percentile rank based on Intermediate Core Bond category, 3-year rolling returns computed monthly. Regime break at 6/30/2009. As of 12/31/2025.
[5] Bloomberg, Clearstead, Bloomberg US Corporate High Yield Index statistics,. As of 12/31/2025
[6] Bloomberg, Returns for Bloomberg US Corporate High Yield Index and Bloomberg US Aggregate Index
[7] Asset-Backed Securities (ABS), A U.S. securitized products primer,” Janus Henderson Investors, August 1, 2025
[8] Reserve Bank of Australia. (2024, October 17). Growth in Global Private Credit
[9] Preqin. (2024, April 8). Private Debt’s Rapid Growth Merits Closer Scrutiny, IMF Says
[10] Bloomberg, see Rolling Three-Year Stock/bond Correlations Chart above.
Disclosures: Information provided in this article is general in nature, is provided for informational purposes only, and should not be construed as investment advice. These materials do not constitute an offer or recommendation to buy or sell securities. The views expressed by the author are based upon the data available at the time the article was written. Any such views are subject to change at any time based on market or other conditions. Clearstead disclaims any liability for any direct or incidental loss incurred by applying any of the information in this article. All investment decisions must be evaluated as to whether it is consistent with your investment objectives, risk tolerance, and financial situation. You should consult with an investment professional before making any investment decision. Performance data shown represents past performance. Past performance is not an indicator of future results. Current performance data may be lower or higher than the performance data presented. Performance data is represented by indices, which cannot be invested in directly.
Related or Tagged New Posts

market perspectives
April 1st 2026
March Review 2026
market perspectives
March 2nd 2026
February Review 2026
market perspectives
February 2nd 2026
January Review 2026
market perspectives
January 6th 2026
December Review 2025
market perspectives
December 1st 2025
November Review 2025

market perspectives
December 1st 2025
Market Update | Private Credit
market perspectives
November 3rd 2025
October Review 2025
market perspectives
October 1st 2025
September Review 2025
market perspectives
September 2nd 2025
August Review 2025
market perspectives
August 1st 2025
July Review 2025
market perspectives
July 1st 2025
June Review 2025
market perspectives
June 2nd 2025
May Review 2025