OVERVIEW
Normally fundamentals drive the performance of financial markets. In February the economic data was most favorable—CPI came in better than expected, the unemployment rate fell to 4.3%, and after years of hovering below 50, the January ISM Manufacturing reading broke out to 52.6, potentially signaling an expansion in U.S. manufacturing.[1] But the markets looked right past the fundamentals and focused on anxiety scenarios to drive their investment decision making.
In recent weeks, markets have been fixated on the companies and sectors that could be severely disrupted by innovation in the Artificial Intelligence (AI) space. In late January, a new AI model from Anthropic that aids in coding sparked a sell-off in the software sector. Today, investors continue to assess the likelihood that the sector’s profit margins and subscription-based business models might be severely disrupted by AI, both by reducing employment and increasing efficiency as enterprises develop home-grown software solutions. This angst over AI-disruption has spread to other sectors, including media, IT consulting, legal services, advertising, logistics, and financial services.
Geopolitics stoked fears throughout the month and ended with the US and Israeli strikes on Iran and Tehran’s broad retaliatory attacks. The death of Supreme Leader Ayatollah Ali Khamenei, widespread regional airspace shutdowns, multi‑country missile exchanges, and threats to key energy corridors—particularly the Strait of Hormuz—have introduced significant geopolitical risk premiums across global assets.
February was a month of dispersion and contrasts with lackluster returns for the S&P 500, but ample opportunities for positive returns for diversified investors. As for fixed income, anxiety had investors seeking safety in U.S. Treasuries.
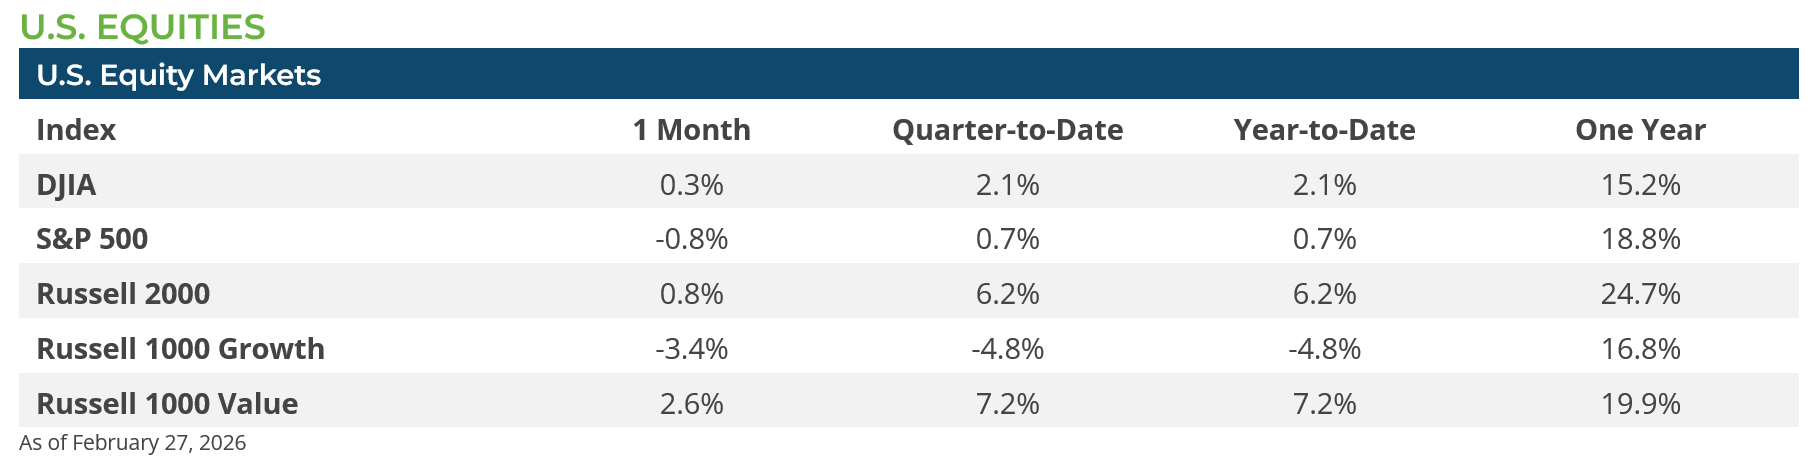
The headline market-cap weighted S&P 500 fell by -0.8% in February, but the equal-weight S&P rose by 3.6%, while mid-caps (Russell Midcap Index +3.8%) and small caps (Russell 2000 +0.8%) also made gains for the month. Since December 1, 2025, the S&P 500 has traded between roughly 6,750 and 6,980 on a closing basis, a tight 3.4% trading range and has repeatedly failed to break above the 7,000 level.[1]Despite a muted headline return for February, there was a tremendous amount of activity beneath the surface as investors digested the latest wave of AI disruption fears and market gains continued to broaden out to the non-tech parts of the equity market. However, performance dispersion was also particularly notable within the Technology sector, with memory names like Sandisk (SNDK) rising by 10.3%, while financial software stock Intuit (INTU) fell by -18.0%.[1] The Mag-7—Alphabet, Amazon, Apple, Meta, Microsoft, NVIDIA, and Tesla—continued to lag the market in February, declining by -7.3%. Investors increasingly are turning to cash-flow generators, dividend payers, and cyclical themes rather than speculative growth.[1] Case in point, the leading sectors in February were the cyclical sectors of Energy (+9.4%) and Materials (+8.4%), along with dividend-oriented sectors such as Utilities (+10.4%) and Consumer Staples (+7.9%).
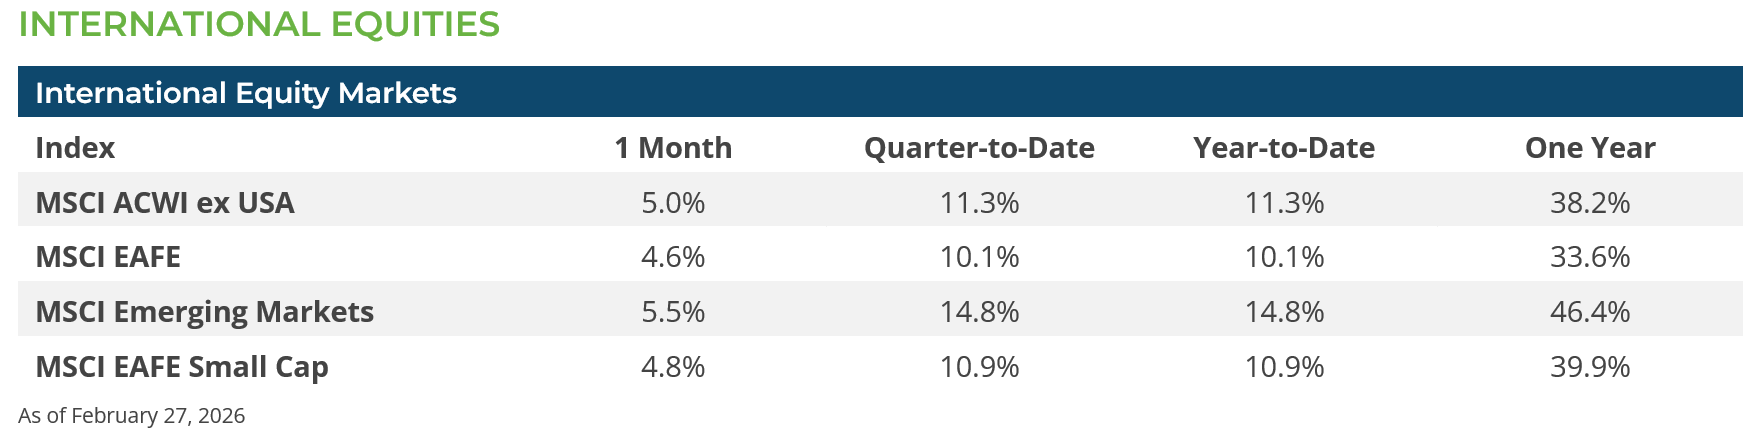
February was very good for international equity markets, with developed market equities (MSCI EAFE Index +4.6%) and emerging markets (MSCI EM Index +5.5%) both outpacing US equity returns. These gains were made despite the US dollar gaining ground modestly against a broad range of mostly developed-market foreign currencies. South Korea stood out again in February with its equity market (MSCI Korea Index) surging by over 22.6% in dollar terms on the back of continued strong gains in its semiconductor sector stocks. The gains in emerging market index stocks are also notable given that Chinese equities (MSCI China Index -5.8%) were a drag on global market stock markets as the Chinese government contemplated new taxes on some tech sectors that weighed on market sentiment.
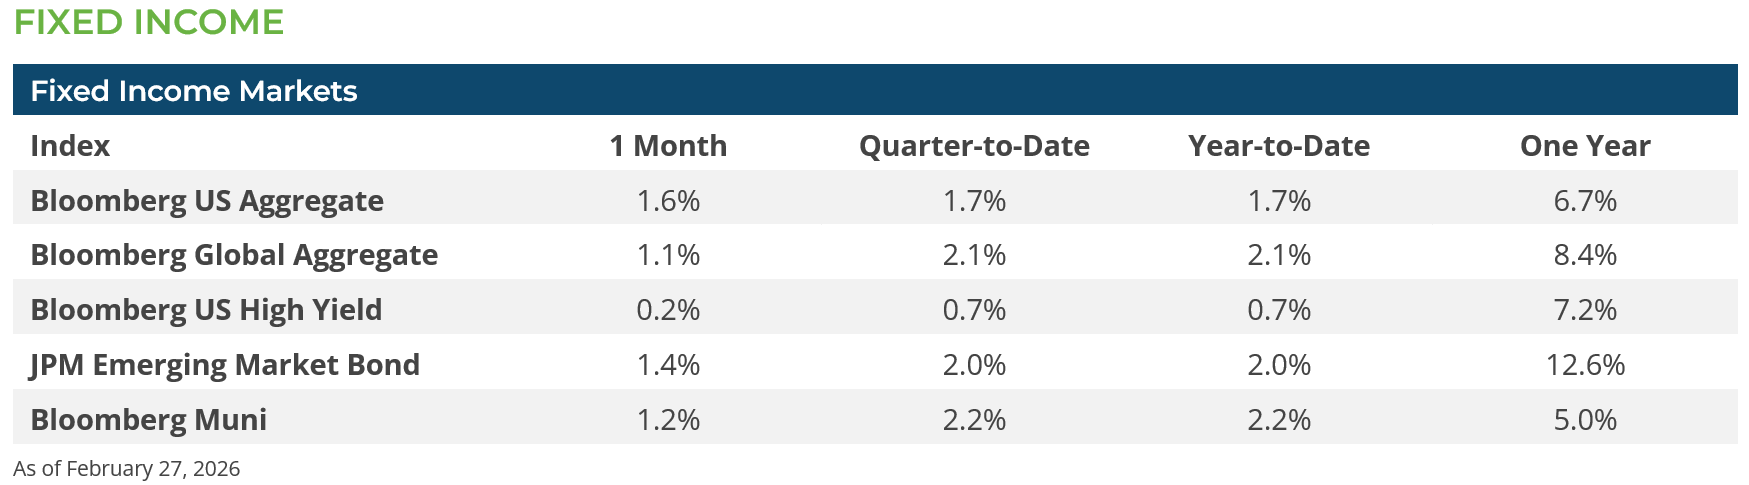
U.S. interest rates significantly declined in February as the safe haven of choice for investors concerned about the disruptive nature of AI, the growing tensions between the U.S. and Iran, and the press’s obsession with private credit. The US Treasury 10-year yield declined from 4.24% to 3.94%, the 30 bps decline was similar across the yield curve from 5 to 30 years. Not surprisingly, U.S. Treasuries were the star sector of the Bloomberg U.S. Aggregate index.
High yield investments lagged in the risk-off dash to the safe haven status of Treasuries as spreads widened by 26 bps but still delivered a positive return for the month. Fixed income investing, in general, had a solid month, but in a risk off environment the perceived safety of U.S. Treasury bonds was difficult to beat.
CONCLUSION & OUTLOOK
For all the commotion in February, very little has changed long-term trends. U.S. Treasury 10-year yields have yet to break out of a range they have occupied for over two years and the S&P 500 index is only 1.4% below its all-time high. But the financial markets have been in a position to be challenged by volatility. Expensive stocks and corporate bonds were prime targets for sale when challenging news confronted investors.
But, has the economic environment materially changed in one, short, month? Unemployment remains at a historically low level. Inflation has significantly declined and appears to be contained. Corporate earnings are rising and balance sheets are solid. There will be winners and losers, but that is always the case. The key to success is to be a long-term investor, stay in the game and not watch from the sidelines.
Subscribe to our weekly Research Corner and other market commentary so you don’t miss our updates.
[1] Bloomberg LP
DISCLOSURES: Information provided in this article is general in nature, is provided for informational purposes only, and should not be construed as investment advice. The views expressed by the author are based upon the data available at the time the article was written. Any such views are subject to change at any time based on market or other conditions. Clearstead disclaims any liability for any direct or incidental loss incurred by applying any of the information in this article. All investment decisions must be evaluated as to whether it is consistent with your investment objectives, risk tolerance, and financial situation. The performance data shown represent past performance. Past performance is not an indicator of future results. Current performance data may be lower or higher than the performance data presented.
Related or Tagged New Posts

market perspectives
February 17th 2026
Beyond the Agg

market perspectives
February 2nd 2026
January Review 2026
market perspectives
January 6th 2026
December Review 2025
market perspectives
December 1st 2025
November Review 2025

market perspectives
December 1st 2025
Market Update | Private Credit
market perspectives
November 3rd 2025
October Review 2025
market perspectives
October 1st 2025
September Review 2025
market perspectives
September 2nd 2025
August Review 2025
market perspectives
August 1st 2025
July Review 2025
market perspectives
July 1st 2025
June Review 2025
market perspectives
June 2nd 2025
May Review 2025
market perspectives
May 1st 2025
April Review 2025