
Executive Summary
Markets reacted sharply in the early hours of the sudden escalation following U.S. Israel strikes on Iran and Tehran’s broad retaliatory attacks. The death of Supreme Leader Ayatollah Ali Khamenei, widespread regional airspace shutdowns, multi country missile exchanges, and threats to key energy corridors—particularly the Strait of Hormuz—have introduced significant geopolitical risk premiums across global assets.
Energy Markets
The most logical impact of a prolonged conflict in Iran is for the energy complex. Oil prices have been volatile and trending upward as traders reassess supply risk around the Strait of Hormuz—through which roughly 20% of global oil (approximately 20 million barrels of crude oil) and natural gas flows.[1] Iran publicly signaled that ships “are not allowed” through the Strait, materially increasing concerns of a chokepoint disruption. The impact of supply constraints from the Strait is more appreciably felt by the eastern world, where about 84% of the crude oil moving through the Strait is bound for China, India, Japan, and South Korea.[1] However, Europe remains vulnerable to a curtailing of LNG exports from Qatar.[2]
Airstrikes across Iran and retaliatory attacks on Gulf states have kept the region “on edge,” adding further upward pressure on crude benchmarks. Oil is likely to remain more volatile than usual, with its impacts felt more by those previously noted economies.
Global Aviation and Transportation
The shutdown of airspace across Iran, Israel, Jordan, Iraq, Qatar, Bahrain, Kuwait, and the UAE has had broad logistical implications for airlines and cargo flows. This has contributed to higher jet fuel demand volatility and increased freight costs as carriers reroute around the Middle East.
More than a dozen global carriers—including Emirates, Etihad, KLM, Virgin Atlantic, and Wizz Air—have cancelled or suspended routes, creating bottlenecks in international travel and supply chain movement.
Risk Assets and Equities
Risk‑off sentiment has intensified across global equity markets as investors price in the possibility of a wider regional war:
- After declining 1.5% in the late overnight futures sessions last night, the S&P 500 recovered to nearly unchanged by midday 3/2/2026. We expect continued bouts of volatility as the conflict wears on and until the strategy and end game are clearer.[3]
- Before this conflict, other fears related to software and AI had been causing significant volatility underneath the surface. Investors now have one more reason to be skeptical and as a result Clearstead is mindful of the fact that markets may see continued short-term pressure—our research team would not be surprised to see the S&P 500 test support, which we would say rests around 6,500 (or about -5% lower from where markets stood midday 3/2/2026.[3]
- Overseas equity markets, particularly in parts of Asia, may get the brunt of volatility given the heavier reliance on oil making its way through the Strait of Hormuz.
Fixed Income and Safe Havens
Flight‑to‑quality flows accelerated only to reverse:
- The knee jerk reaction of seeking out safety in U.S. Treasuries quickly reversed as equity markets rebounded and as investors debated the dueling forces of inflation pressures vs. depth of conflict. As of now, bond markets seem more focused on the inflationary pressures that may result from this conflict.
- The dollar (DXY) is up 0.95% while gold is up 1.2%, as of midday 3/2/2026.[3]
Forward Outlook
The conflict’s trajectory remains uncertain. Key market sensitivities going forward include clarity on Iran’s political succession following Khamenei’s death, further U.S.–Israel operations and the scale of Iranian retaliatory capabilities. The immediate concern for markets remains in the energy complex and how prolonged closure or disruption of the Strait of Hormuz could reshape global energy markets if sustained. Lastly, all eyes will be on avoiding regional spillover, with explosions and missile strikes already impacting Qatar, UAE, Kuwait, and Israel.
For financial markets, Clearstead would not be surprised to see the S&P 500 test its technical support, as we noted previously. The US Treasury markets remain very complex and the flight to safety trade that defined US treasuries in yesteryear may not come to pass this time around as deficits, treasury supply, and inflation pressures all stand in contrast to historical analogs. With all of this said, it is important to think back to the many “wall of worry” charts we have shown in the past that illustrate the miniscule nature of these small, regionalized outbreaks for long-term investors. US economic strength continues to be evident in earnings calls, economic data, and labor markets. If, and as that may change, we stand ready to adapt client portfolios.
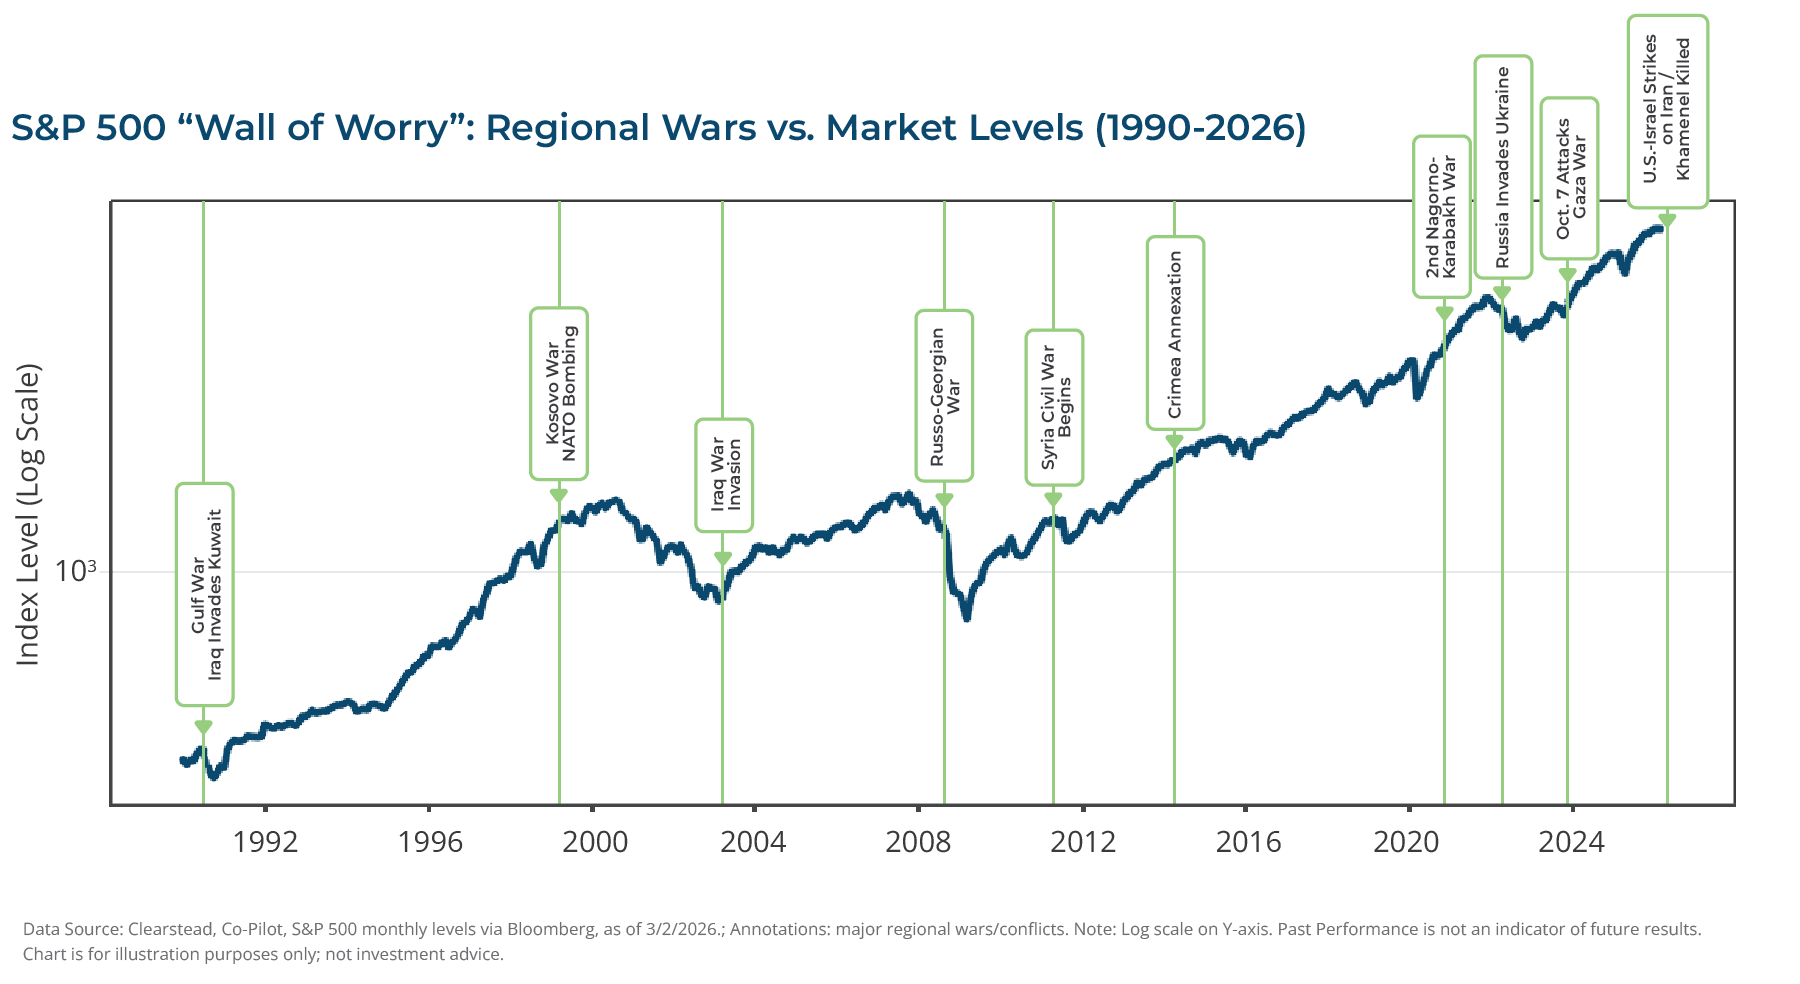
Annotations Include:
- Gulf War (1990–91)
- Kosovo (1999)
- Iraq War (2003)
- Russo–Georgian War (2008)
- Syria Civil War onset (2011)
- Crimea Annexation (2014)
- Second Nagorno-Karabakh War (2020)
- Russia–Ukraine invasion (2022)
- Israel–Hamas war (Oct 7, 2023)
- US–Israel strikes on Iran with Strait of Hormuz disruption and Khamenei’s death (Feb–Mar 2026).
[1] US Energy Information Administration
[2] https://www.consilium.europa.eu/en/infographics/where-does-the-eu-s-gas-come-from/
[3] Bloomberg LP
Information provided in this article is general in nature, is provided for informational purposes only, and should not be construed as investment advice. These materials do not constitute an offer or recommendation to buy or sell securities. The views expressed by the author are based upon the data available at the time the article was written. Any such views are subject to change at any time based on market or other conditions. Clearstead disclaims any liability for any direct or incidental loss incurred by applying any of the information in this article. All investment decisions must be evaluated as to whether it is consistent with your investment objectives, risk tolerance, and financial situation. You should consult with an investment professional before making any investment decision. Performance data shown represents past performance. Past performance is not an indicator of future results. Current performance data may be lower or higher than the performance data presented. Performance data is represented by indices, which cannot be invested in directly.
Related or Tagged New Posts

market perspectives
March 23rd 2026
Research Corner | 3/23/2026
market perspectives
March 16th 2026
Research Corner | 3/16/2026
market perspectives
March 9th 2026
Research Corner | 3/9/2026
market perspectives
March 2nd 2026
Research Corner | 3/2/2026
market perspectives
February 23rd 2026
Research Corner | 2/23/2026
market perspectives
February 16th 2026
Research Corner | 2/16/2026

market perspectives
February 12th 2026
Market Update | US Dollar Debasement
market perspectives
February 9th 2026
Research Corner | 2/9/2026
market perspectives
February 2nd 2026
Research Corner | 2/2/2026
market perspectives
January 26th 2026
Research Corner | 1/26/2026
market perspectives
January 20th 2026
Research Corner | 1/20/2026
market perspectives
January 12th 2026
Research Corner | 1/12/2026