OVERVIEW
The U.S. economy appears to be starting the new year on rather positive footing. Real GDP growth for Q3-2025 was revised higher to 4.4% (annualized), up from the initial estimate of 4.3%, due to upward revisions to both exports and changes in inventories.[1]While the Atlanta Fed’s GDPNow model estimate for real GDP growth in the fourth quarter of 2025 is 4.2%.[2] Supporting the positive economic outlook has been headline inflation data coming in better than expected in December and unemployment claims remaining low and stable, giving credence to the “no hire, no fire” labor market. To top it off, the Q4 earnings season is off to a good start, and analysts are expecting S&P 500 companies to report double-digit earnings growth for calendar year 2026.
The Federal Reserve wrapped up a two-day policy meeting and delivered pretty much what the market expected—holding the benchmark Fed funds rate in a range between 3.5%-3.75%. Also, not totally unexpected, President Trump has announced that he intends to nominate Kevin Warsh to succeed Jerome Powell as chair of the Federal Reserve. Although the FOMC’s lack of action broke a string of three straight cuts, it appears they remain biased to easing and, with the nomination of Warsh, there is virtually no thoughts of a tighter monetary policy.
Financial markets delivered positive returns for the month of January, as the S&P 500 was up 1.44% and, despite interest rate being marginally higher, the Bloomberg Aggregate was up 0.11%. But hidden within the S&P 500 returns was a strong rotation away from the mega-cap tech stocks and towards last year’s sector laggards. Lots of good news has already been baked into the share prices of some of the US’s largest tech names and, so far in 2026, investors seem to be gravitating towards a more diverse set of stocks and sectors.
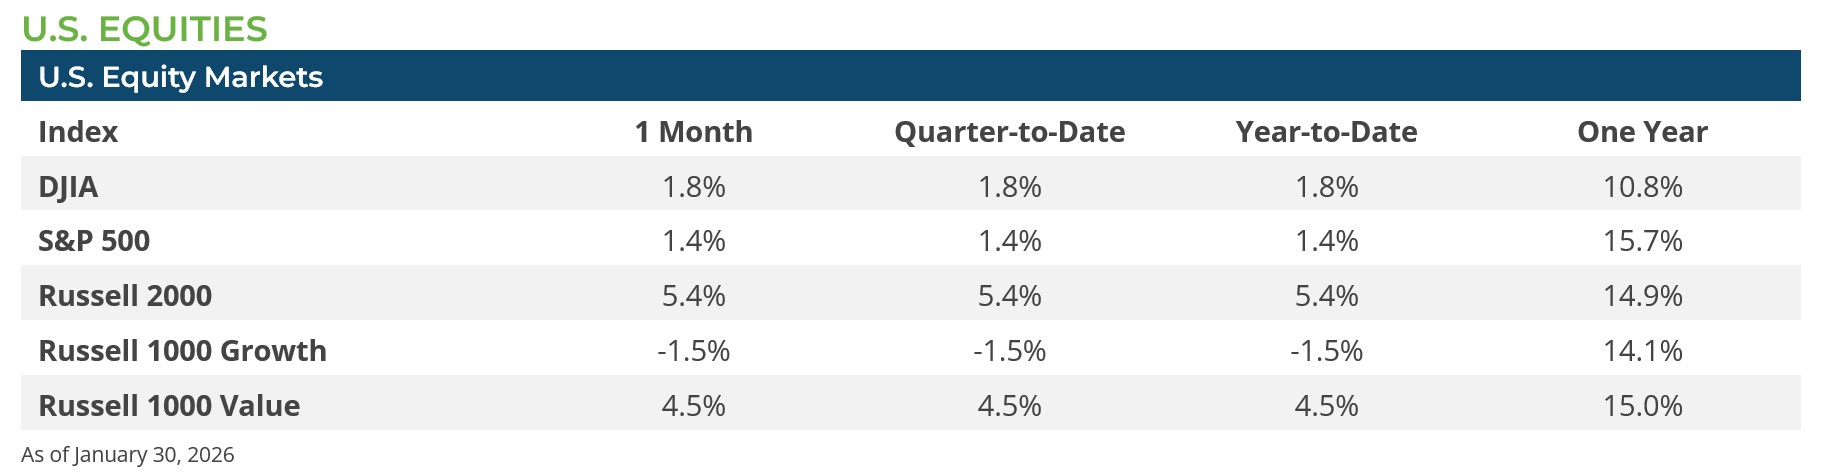
January was broadly positive for US equities but there was a wide dispersion of equity returns during the month. The headline was that the S&P 500 gained only about 1.4%, but US small caps (Russell 2000 Index) gained over 5.4% and US midcaps (Russell Midcap Index) gained 3.1%.[1] The positive start to the year bodes well for risk assets for the rest of year. Since 1946, when January is positive for the S&P 500, history has shown that about 9 out 10 times the S&P 500 finished the year with positive returns overall.[1] Similarly, the sectors that historically performed best in January often are the sectors that subsequently lead equity returns for the remainder of the year.[3] This year’s gains, thus far, have been led by Energy (+14.4%), Materials (+8.7%), and Consumer Staples (+7.7%).[1] In fact, Energy and Consumer Staples gained more in January-2026 than they did in all of 2025. As the sector returns might suggest, more value-oriented stocks outperformed their growth-stock peers across the cap-spectrum in January.
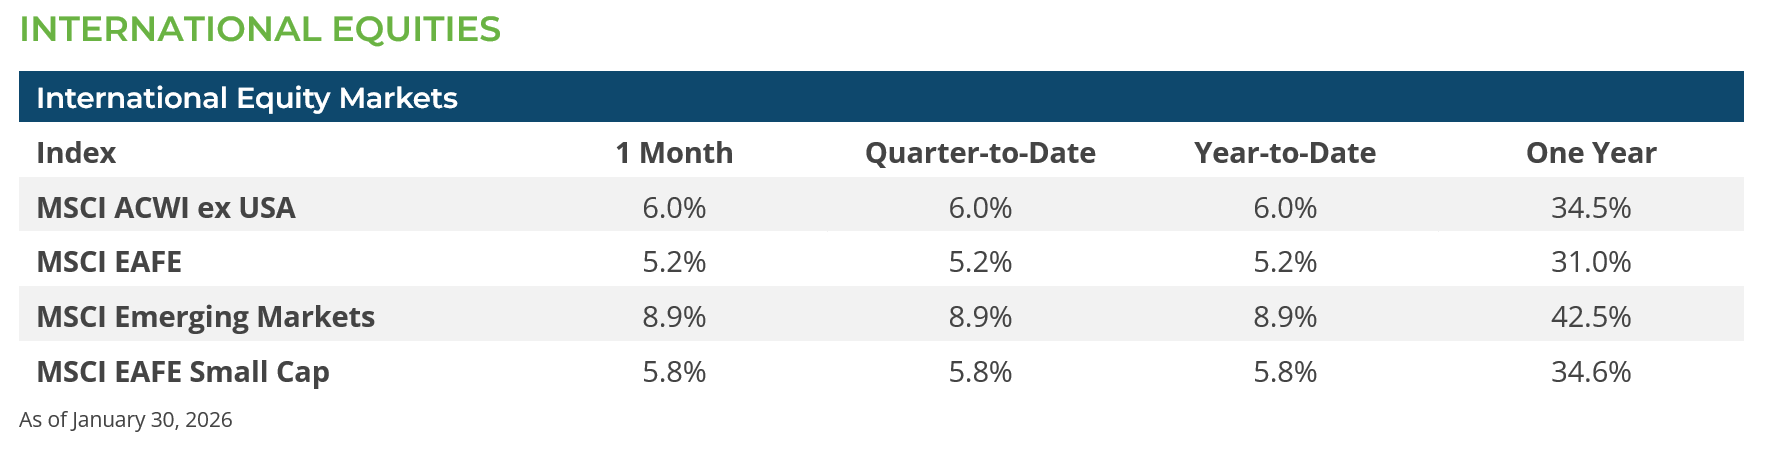
January was even more positive for non-US equities. International developed market equites (MSCI EAFE Index) gained 5.2% during the month, while emerging market equities (MSCI EM Index) gained 8.9%. International developed market returns were helped marginally by a weaker dollar, but the US dollar had little impact on the returns of emerging market equities. The preponderance of emerging market returns were driven by continued strong gains in South Korean (MSCI Korea Index +27.8%) and Taiwanese (MSCIA Taiwan +11.1) equities, and their tech stocks in particular, as well as the materials and energy companies that comprise some of the largest exposures in Latin American equity markets. In contrast, Chinese equities (MSCI China Index +4.7%) underperformed the broader EM index in January while Indian equities (MSCI India Index -4.8%) were an outlier with negative returns for the month. Similar to the US, non-US small cap stocks outperformed their large cap peers (MSCI ACWI ex US Index +6.0% vs. MSCI ACWI ex US Small Index +6.4%).
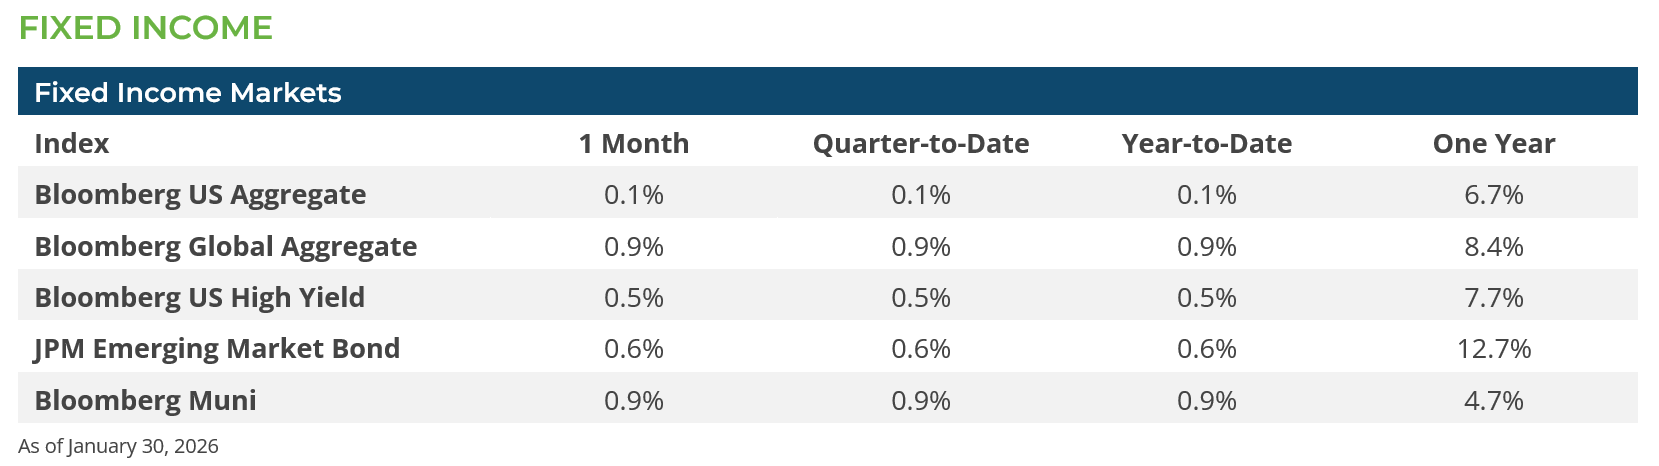
U.S. Treasury interest rates rose a bit in January, but not enough to wipe out the earnings from coupon income. The Bloomberg Aggregate index’s price was down 0.23% but, combined with about 0.34% of income earnings, the index eked out a 0.11% return for the month. The municipal market’s light supply calendar, reinvestment demand, and the attractive absolute level of tax-exempt yields resulted in solid performance as the Bloomberg Municipal bond index returned 0.94% for the month. Fixed income investors entered the month believing there would be at least two more 25 bps cuts in the Fed’s 2026 playbook. But a stable economy and a Fed in a holding pattern have tempered the tailwind that was leading to lower rates. That doesn’t mean rates are going higher and spreads will rise, but a year of simply earning your coupon income might be what we should expect in 2026.
CONCLUSION & OUTLOOK
A solid economy, positive corporate fundamentals, and a Fed unlikely to tighten monetary policy in 2026 provides the ingredients for what we believe will lead to another positive year for financial markets. However, valuations, across the board, are rich and challenging investors to continue to buy high-priced assets. The lofty price/earnings ratios of U.S. equities and the tight spreads of U.S. corporate bonds could be impediments for a repeat of 2025 returns.
The problem with valuations is that they are generally considered poor timing tools for buying or selling in the short term, as high valuations can persist for extended periods, and market timing based on them often results in missed gains. Additionally, some upward movement in valuations from historic norms may be justified based on S&P 500 companies having higher profit margins and lower overall debt burdens than what was the norm in decades prior. Overall, valuations, while valuable for predicting the broad pattern of long-term, multi-year returns, are ineffective for forecasting market movements in the next few months or even years.
Subscribe to our weekly Research Corner and other market commentary so you don’t miss our updates.
[1] Bloomberg LP 1/31/2026
[2] https://www.atlantafed.org/cqer/research/gdpnow as of January 29, 2026
[3]https://www.fidelity.com/viewpoints/active-investor/january-barometer
DISCLOSURES: Information provided in this article is general in nature, is provided for informational purposes only, and should not be construed as investment advice. The views expressed by the author are based upon the data available at the time the article was written. Any such views are subject to change at any time based on market or other conditions. Clearstead disclaims any liability for any direct or incidental loss incurred by applying any of the information in this article. All investment decisions must be evaluated as to whether it is consistent with your investment objectives, risk tolerance, and financial situation. The performance data shown represent past performance. Past performance is not an indicator of future results. Current performance data may be lower or higher than the performance data presented.
Related or Tagged New Posts

market perspectives
April 1st 2026
March Review 2026
market perspectives
March 2nd 2026
February Review 2026

market perspectives
February 17th 2026
Beyond the Agg
market perspectives
January 6th 2026
December Review 2025
market perspectives
December 1st 2025
November Review 2025

market perspectives
December 1st 2025
Market Update | Private Credit
market perspectives
November 3rd 2025
October Review 2025
market perspectives
October 1st 2025
September Review 2025
market perspectives
September 2nd 2025
August Review 2025
market perspectives
August 1st 2025
July Review 2025
market perspectives
July 1st 2025
June Review 2025
market perspectives
June 2nd 2025
May Review 2025