OVERVIEW
When we entered the year, Clearstead was of the belief that the consensus estimates for 2026 corporate profits looked solid—in the 11% to 13% range—and that a broader set of companies looked likely to prosper.[1] Valuations were a cause for concern, but multiples have historically not contracted significantly when margins are stable-to-expanding, which we expected was the backdrop for corporate earnings. The US labor market, while fragile, remained stable and inflation was trending lower; as such, the outlook for monetary policy was for additional cuts in the Fed Funds rate. Given this backdrop, our baseline outlook was that, absent a significant negative shock, equity markets were poised to grind higher, while we expected bond markets to earn their coupon.
Unfortunately, we got that negative shock. On February 28, 2026, the US and Israel launched strikes on Iran, which resulted in the death of Supreme Leader Ayatollah Ali Khamenei. Iran has responded with missile and drone strikes against Israel and US allies in the Middle East. Subsequent actions—widespread regional airspace shutdowns, multi-country missile exchanges, and threats to key energy corridors (particularly the Strait of Hormuz)—have introduced significant geopolitical risk premiums across global assets.
In this unstable environment, financial markets have experienced significant volatility. A “risk-off” trend since the 2026 Iran War began has been marked by a decline in major equity indices, a significant rise in interest rates, and a sharp surge in oil prices above $100 per barrel.
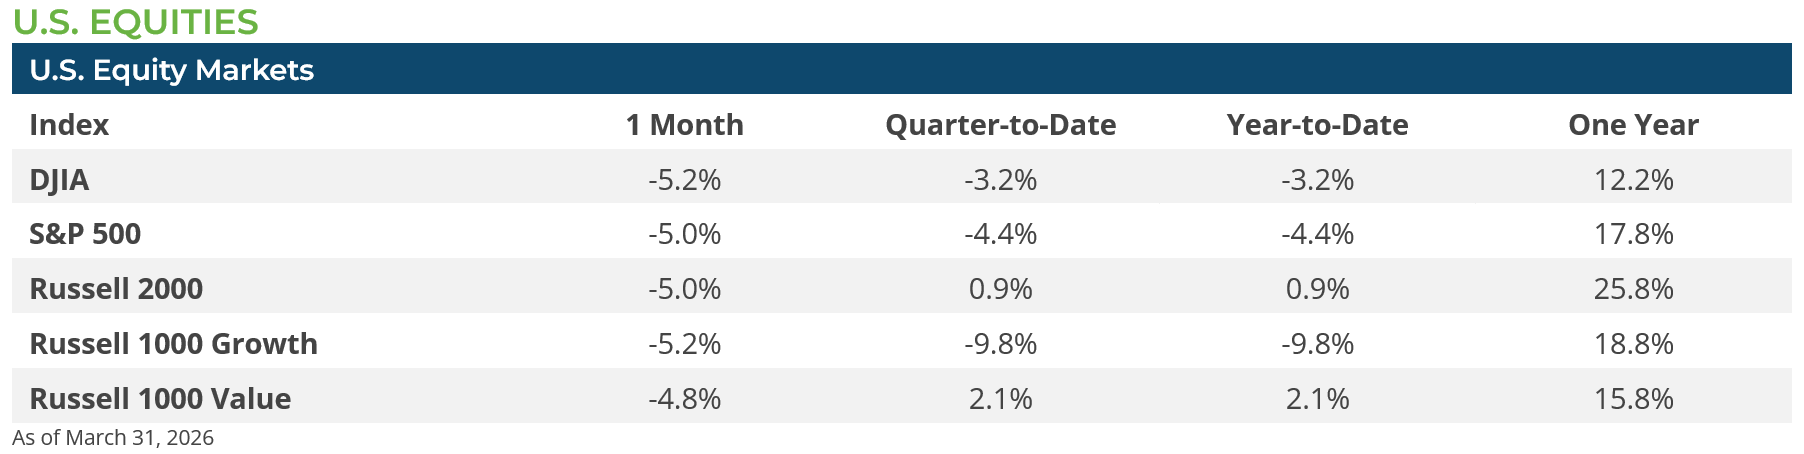
The path of equities in March was dominated by war headlines and the price of oil. The war sparked a risk-off environment and the daily return to equities quickly became negatively correlated with the daily movement in oil prices. On days when the market perceived the conflict would intensify and global energy disruption would last longer, oil prices would move higher and equities would move lower. The result was the S&P 500 losing 5.0% for the month, small caps (Russell 2000 Index) losing 5.0%, and mid caps (Russell Midcap Index) losing 5.3%. In terms of sectors, there was only one bright spot—energy. The Energy sector gained over 10% during March and is now up 38.2% for the year.[1] Whereas every other sector lost ground in March, with Industrials and Healthcare being the hardest hit with both losing over 8%.1 The dispersion between US sector performance has already been quite wide, as IT, Consumer Discretionary, and Financials have all lost over 9% year-to-date (YTD), which is more than a 45 percentage-points difference between their YTD returns and the Energy sector YTD return.
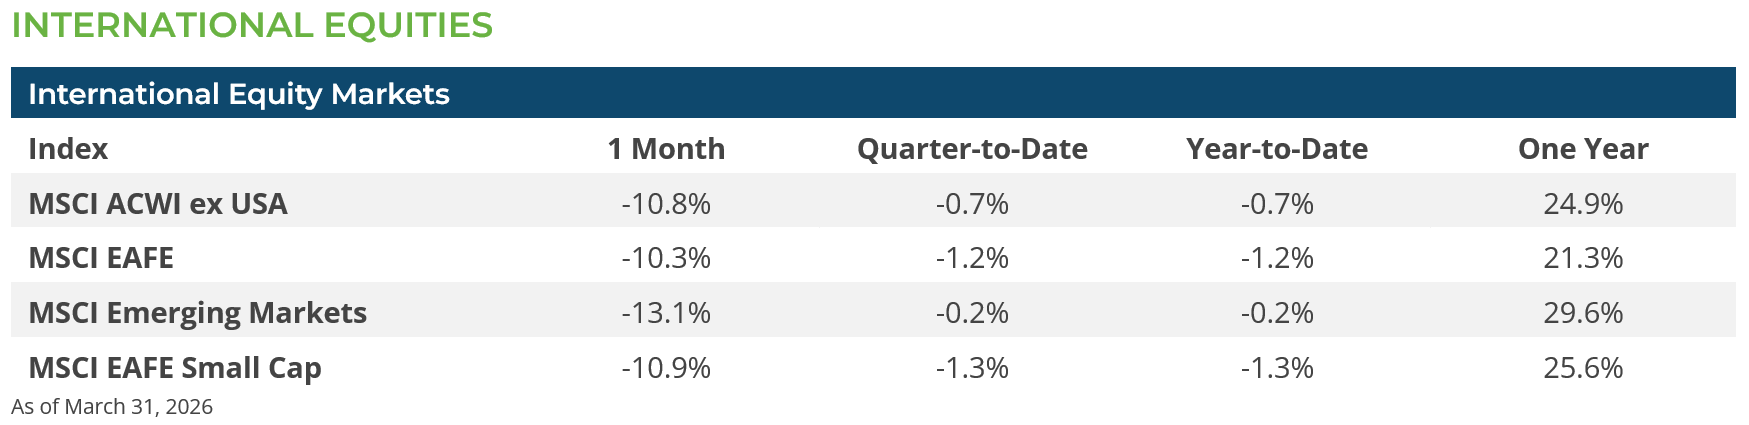
International equities fared even worse in March, with developed market equities (MSCI EAFE Index -10.3%) and emerging market equities (MSCI EM Index -13.1%) wiping out their YTD gains. International equities were hit by both the headwinds related to a stronger US dollar—which subtracts from their US dollar-based returns—as well as by the fact that most of the countries in Asia and Europe that comprise these indices have heavier exposure to energy supplies being disrupted by the US-Iran War. The decline in international equity markets in March is due, in part, to the markets pricing in at least a soft patch in economic growth in many Asian and European countries. The growth in these countries from higher oil and gas prices and specifically some economies in Asia could face possible recessionary conditions if oil and gas markets do not begin to normalize by early summer.
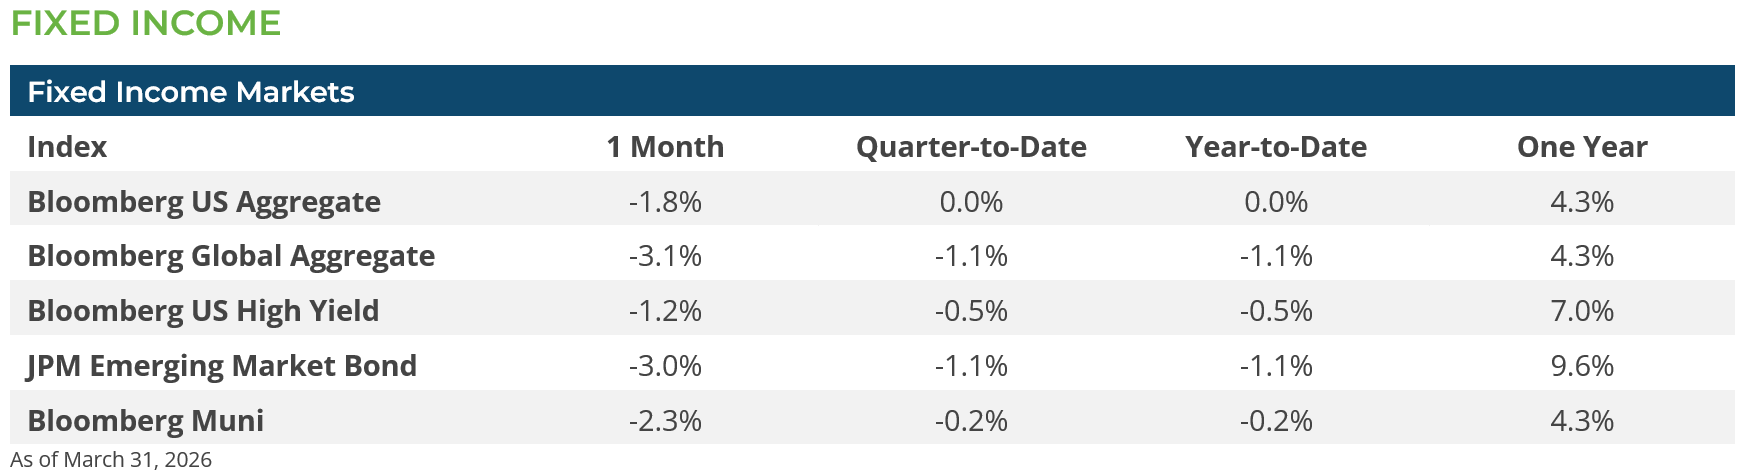
March was a difficult month for fixed income investors as interest rates rose and spreads on risk assets gapped wider. The yield on the U.S. Treasury (UST) 2-year note (3.80%) surpassed the effective Fed Funds rate (3.64%) for the first time since March of 2023.[1] The Fed’s somewhat hawkish statement following its mid-March FOMC meeting was interpreted as a sign that the central bank has ended its easing policy. Even amid the decline in equity markets and conflict between the US and Iran, the safe-haven appeal of UST bonds has not calmed fixed-income investors’ primary concern—persistent inflation. Sticky inflation above the Fed’s 2% inflation target, coupled with elevated energy prices, has weighed on sentiment. As a result, the UST 10-year yield rose 38 bps to 4.32%.[1] The decline in equity markets did have an impact on corporate debt as spreads on the Bloomberg US Corporate High Yield index widened from 291 basis points (bps) to a year-to-date high of 335 bps before closing the month at 317 bps.[1] As seen in the table above, it was difficult to find a hiding place as all the sectors posted negative returns.
CONCLUSION & OUTLOOK
It is during periods like the one we now face when it becomes challenging to prognosticate and say whether the financial markets will rise or fall. Much depends on the length of the US-Iran war and the closure of the Strait of Hormuz. The outcome of the conflict is bimodal: peace/de-escalation should be a boost for markets, while escalation/long-term conflict would be a catalyst for increased volatility, most likely resulting in markets being materially down. In this environment, fundamentals play a subordinate role in the geopolitical crisis in the Middle East.
Human nature wants us to act to protect the portfolio, but it is awfully easy to get whipsawed in these markets and one could end up doing more harm than good. Our approach is to ensure asset allocation is reflective of goals and objectives while using market volatility as an opportunity to rebalance back to long-term targets. In the short term, and until such time when the geopolitical outlook is a bit clearer, we are following a cautious approach in our investment activities.
Subscribe to our weekly Research Corner and other market commentary so you don’t miss our updates.
[1] Bloomberg LP
DISCLOSURES: Information provided in this article is general in nature, is provided for informational purposes only, and should not be construed as investment advice. The views expressed by the author are based upon the data available at the time the article was written. Any such views are subject to change at any time based on market or other conditions. Clearstead disclaims any liability for any direct or incidental loss incurred by applying any of the information in this article. All investment decisions must be evaluated as to whether it is consistent with your investment objectives, risk tolerance, and financial situation. The performance data shown represent past performance. Past performance is not an indicator of future results. Current performance data may be lower or higher than the performance data presented.
Related or Tagged New Posts

market perspectives
March 2nd 2026
February Review 2026

market perspectives
February 17th 2026
Beyond the Agg
market perspectives
February 2nd 2026
January Review 2026
market perspectives
January 6th 2026
December Review 2025
market perspectives
December 1st 2025
November Review 2025

market perspectives
December 1st 2025
Market Update | Private Credit
market perspectives
November 3rd 2025
October Review 2025
market perspectives
October 1st 2025
September Review 2025
market perspectives
September 2nd 2025
August Review 2025
market perspectives
August 1st 2025
July Review 2025
market perspectives
July 1st 2025
June Review 2025
market perspectives
June 2nd 2025
May Review 2025