
US-Iran War Sparks Risk-off Sentiment
“War is the realm of uncertainty; three-quarters of the factors on which action in war is based are hidden more or less in the clouds of great uncertainty.” – Prussian General Carl von Clausewitz
Summary
- Q1-2026 was dominated by the threat of AI disruption for select industries in the first few months and the US-Iran war during March. The war triggered a risk-off environment, elevated energy prices, and pushed several equity indices into correction territory.1
- US economic activity remained stable but showed emerging softness, particularly in labor markets and among lower-income consumer segments.
- Equities posted negative returns with heightened volatility.1 Future performance is binary – tied to the resolution of the war and the potential re-opening of the Strait of Hormuz.
- Fixed-income markets were modestly negative outside short-duration pockets, the curve steepened, and the market no longer expects any Fed cuts for 2026.1
- The broader global economic outlook and the path for risk assets hinges on the duration of the Strait of Hormuz closure, with downside risks (recession odds rising) outweighing upside in the near term. However, corporate fundamentals, AI tailwinds, and U.S. energy independence provide resilience for the U.S. economy and markets.
Economy
US Stable but Facing Headwinds
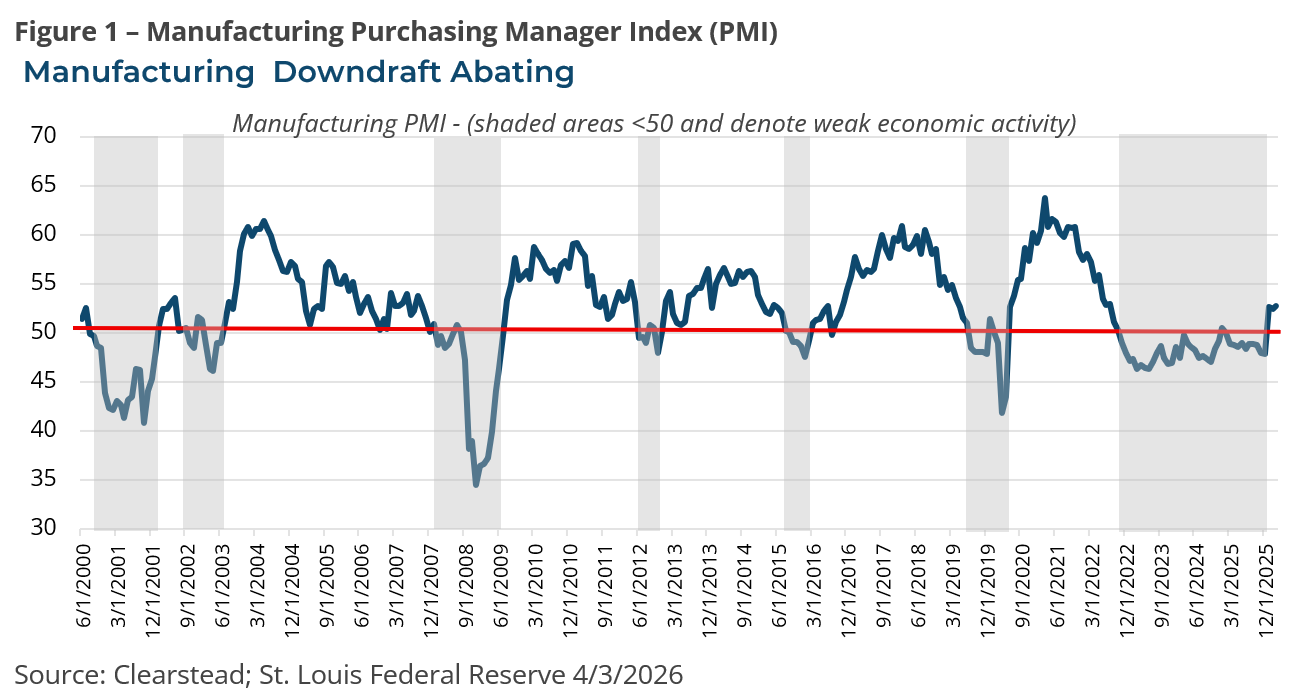
The economy entered 2026 strong, stable, and with a growing number of tailwinds. Economic growth seemed to be picking up in Q1-2026 (Atlanta Fed GDPNow estimate +1.6%) from a modest slowdown in Q4-2025 (real GDP +0.7%).1 The manufacturing PMI suggested a pick-up in industrial sectors, which had been soft for the past three years (see figure 1). The US labor market remained stable if not robust. In addition, there were incentives within the One Big, Beautiful Tax Bill to compel households (tax rebates) and businesses (accelerated depreciation) to increase spending this year. Corporate fundamentals (sales, margins, earnings) looked positive, and equities broadly traded higher for the first two months of the year. However, the US-Iran war, which began in late February, completely changed the dynamic and introduced significant risks to the global economy.
The war has spurred the closure of the Strait of Hormuz, effectively removing 20% of the global supply of oil and gas from the market. This has caused the global price of oil and non-US natural gas to increase substantially in recent weeks, along with the prices of energy byproducts, namely helium, urea, and sulfur.1 The US economy is less exposed to the direct impact of closure of the Strait of Hormuz—the US imports a minimal amount of oil from the Middle East—as compared to many Asian and European countries. Rising energy costs act as a tax on economic activity globally. In the US, gasoline prices are roughly $4.00 per gallon nationally, about a 30% increase from the per-gallon price of gasoline before the war began.1
The US economy remains stable. Unemployment is low at 4.3%, retail sales have been resilient even as the budgets of low-income households are increasingly stretched by the recent rise in gas prices, and businesses overall have not reduced spending or hiring plans. However, the longer the war persists and energy prices remain elevated, many Asian and even some European economies, which are highly dependent on Middle Eastern oil and gas, are likely to see weakening economic activity. They could even face recessionary pressures if global energy markets have not normalized by mid-summer. While a US recession seems highly unlikely, the US economy would undoubtedly be better off if growth outside of the US were accelerating.
Equity Markets
March’s Risk Off Sentiment & Cloudy Outlook
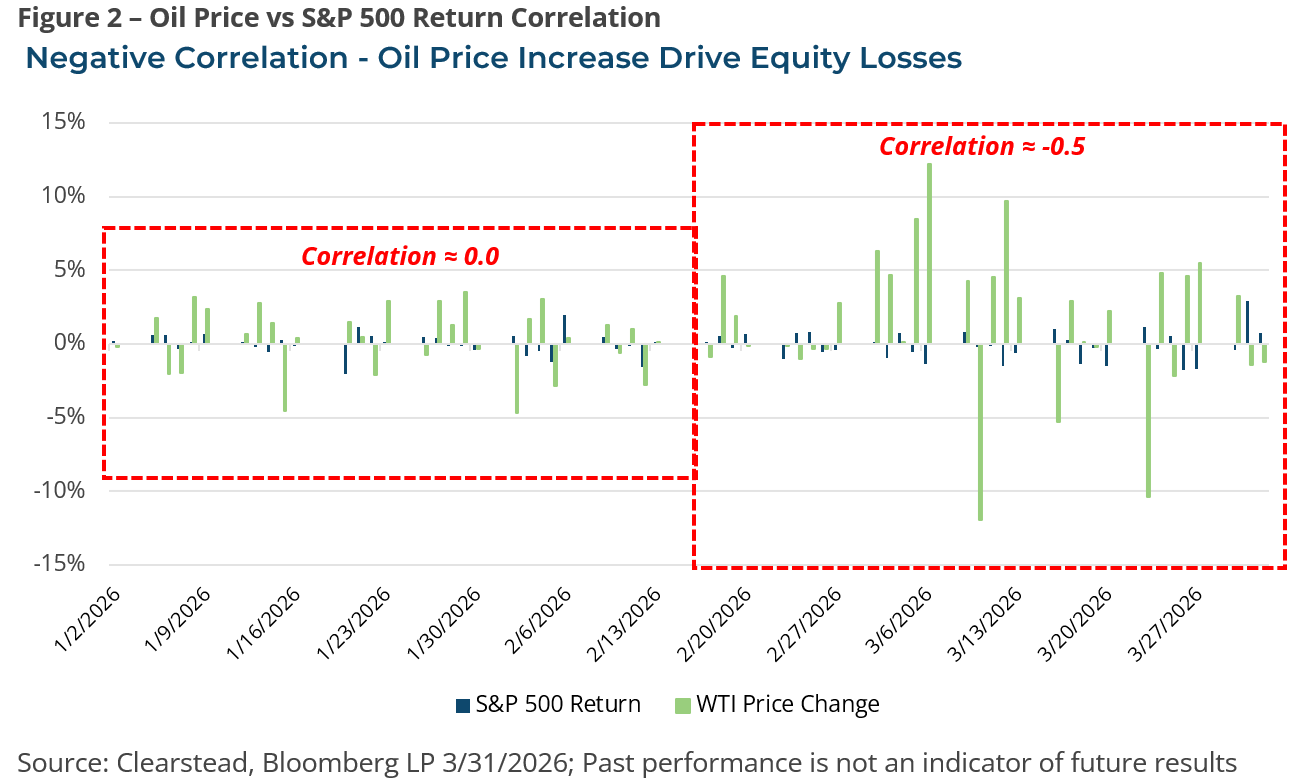
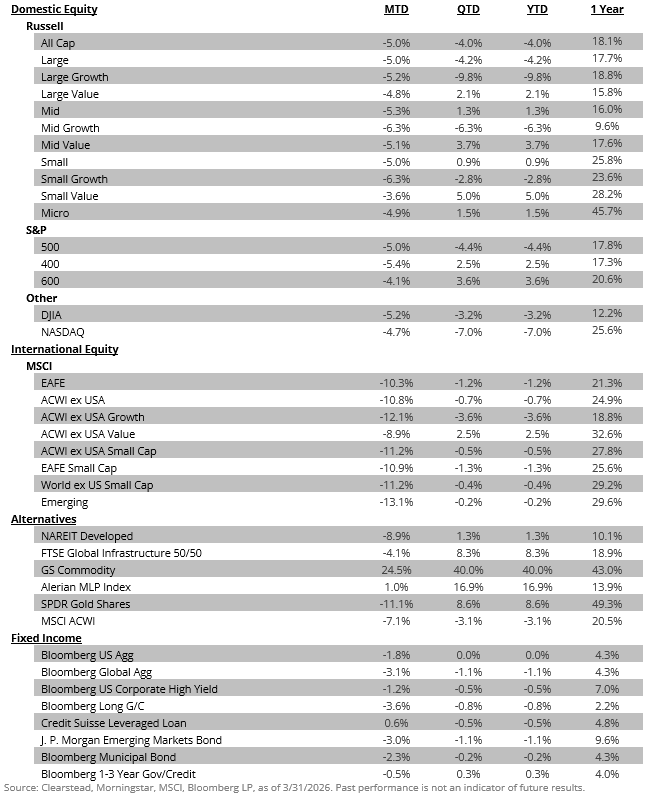
US equities started the year off with a bang. By the end of February, the S&P 500 had gained about 0.7%, while small caps (Russell 2000) had risen more than 6.0%. However, the war and the subsequent rise in energy prices ushered in a reversal of investor sentiment. As a result, risk assets have been highly correlated with war-related headlines over the past several weeks. On days that saw an intensification of battle, energy prices moved higher, while equities moved lower and vice versa (see Figure 2). The VIX—the so-called fear gauge—spiked in March and remains elevated. Many global equity indices sold off sharply in March. Despite the broad-based downturn in equities in March, for the entirety of Q1, more value-oriented names outperformed their growth peers (Russell 1000 Value +2.1% vs. Russell 1000 Growth -9.8%). Given the rise in oil prices, the Energy sector (+38.2%) performed best during Q1, followed by lower beta, more economically resilient sectors such as Utilities (+8.3%) and Consumer Staples (+7.7%). Overall, the S&P 500 finished Q1-2026 4.3% lower, but mid and small-cap stocks (Russell Midcap and Russell 2000 Indexes) gained 1.3% and 0.9%, respectively.1
International markets were hit harder by the US-Iran war selloff as their economies are more dependent on Middle Eastern oil imports and typically have equity markets that are more cyclically oriented and sensitive to global growth and trade. International developed markets (MSCI EAFE Index) lost over 10% in March and ended Q1 with a negative return (-0.7%). Similarly, emerging market equities (MSCI EM Index) lost over 13% in March and ended Q1 down -0.2%.1 Overall, several indices, including the NASDAQ, MSCI EAFE, MSCI EM, and Russell 2000, entered a correction by the end of March—defined as a decline of 10 percent or more from recent market peaks. Most equity markets recovered marginally in the early days of April as global investor sentiment about the potential for conflict de-escalation emerged, but markets are likely to remain volatile for much of Q2-2026.
Fixed Income Markets
US 10-Year Less of a Safe Haven Than Before
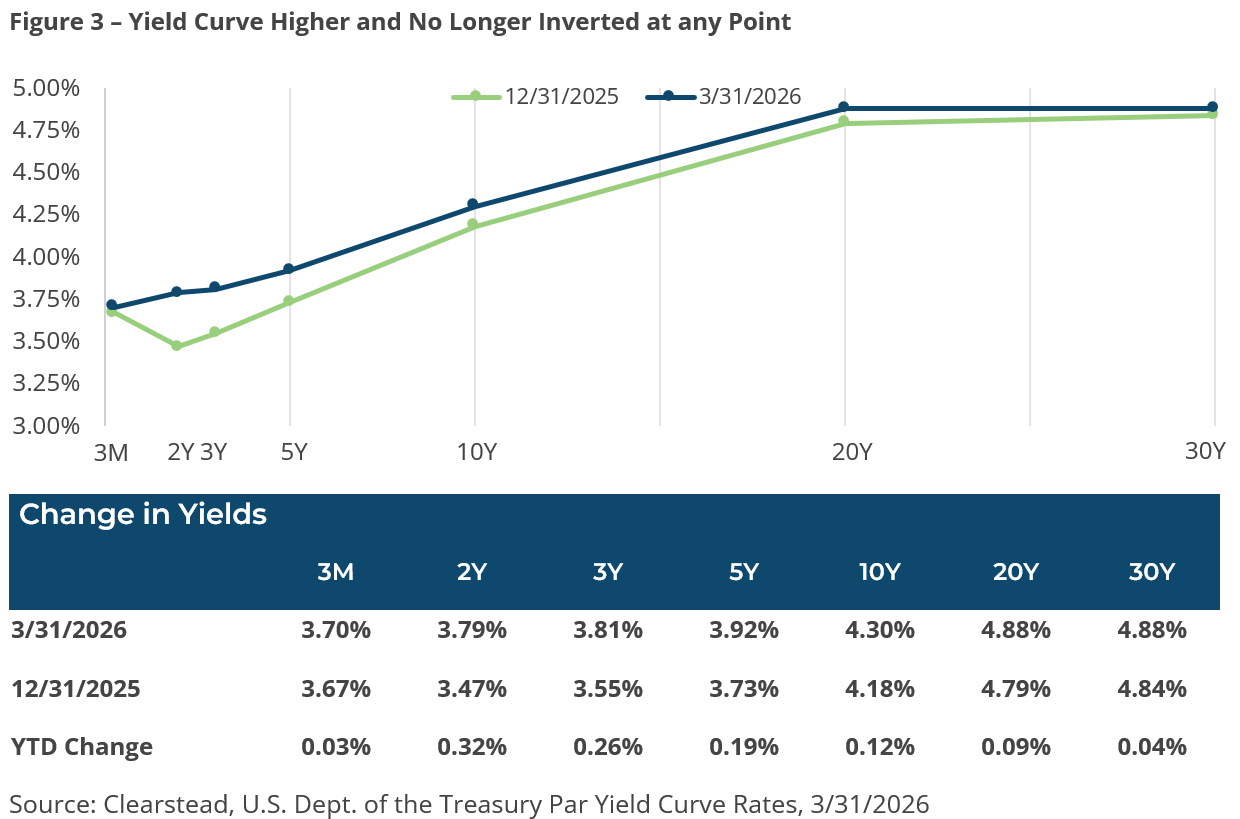
Fixed income markets were volatile in Q1-2026, and it was a difficult period for fixed income investors as interest rates rose and spreads on risk assets gapped wider. In addition, there were three notable developments in fixed income markets during the quarter. The first item of note was that the yield on the U.S. Treasury (UST) 2-year note ended the quarter at 3.79%, surpassing the effective Fed Funds rate (3.64%) for the first time since March of 2023.1 The 2-year yield is considered a leading indicator because it often moves ahead of Federal Reserve policy, reflecting market expectations for future interest rate changes. The Fed’s somewhat hawkish statement following its mid-March FOMC meeting was interpreted as a sign that the central bank has ended its easing policy. The 32-basis-point (bps) rise in the UST 2-year yield has led some forecasters to predict that the Fed’s next move could mark the start of a tightening cycle. The second notable development, amid a decline in equity markets and war in the Middle East, is that the safe-haven appeal of UST bonds has not calmed fixed-income investors’ primary concern—persistent inflation. Sticky inflation above the Fed’s 2% inflation target, coupled with elevated energy prices, has weighed on sentiment. As a result, the UST 10-year yield rose 12 bps to 4.30%, although in previous times of geopolitical turmoil, Treasuries have rallied and yields have typically moved lower. Persistent budget deficits have prompted the US Treasury Department to issue record amounts of long-term debt. Interest costs on government debt are on track to become the largest expense in the federal budget. Interest outlays have already surpassed defense spending and are projected to surpass annual Medicare spending in 2028 and annual Social Security payments in 2047, becoming the single largest budget category.2 This has led to a rise in the term-premium for longer-dated US bonds as investors are increasingly seeking higher yields.
Summary & Outlook
Despite recent volatility, the 2026 base-case outlook for the U.S. economy and markets remains cautiously optimistic—assuming the US-Iran war begins to de-escalate in the coming weeks. Economic growth in the U.S. is still expected to continue at a modest pace (≈2% real GDP growth) with no recession as the baseline—supported by resilient consumer spending, less tariff uncertainty, and fiscal stimulus. Corporate earnings are still projected to grow double-digits in 20263, there are signs of productivity improvement, and the build-out of AI-oriented infrastructure (models, datacenters, energy sources) looks to continue.
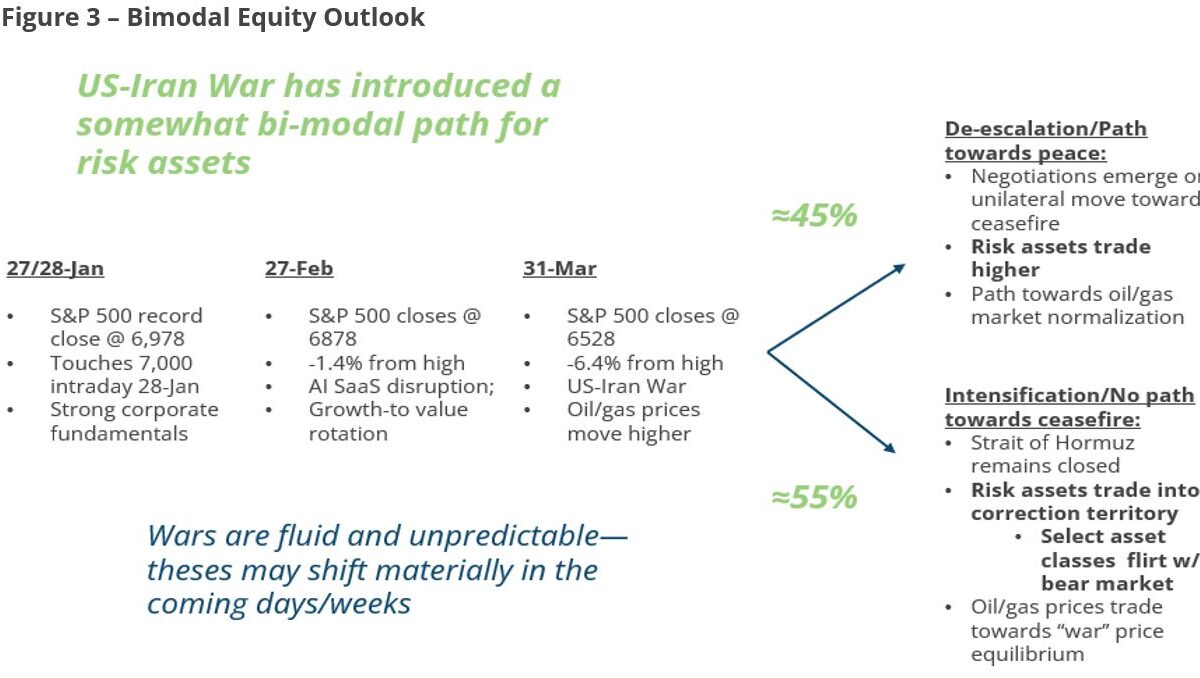
However, several key uncertainties and risk scenarios could lead to a wide range of outcomes for the US economy and financial markets. The ongoing US-Iran conflict is the biggest wild card in the near term, creating a bifurcated risk outlook for markets. Meanwhile, other risks—from persistent inflation to the US election cycle—also bear watching.
Given this backdrop, the Q2-2026 outlook is bi-modal and fluid, driven by the US-Iran conflict. A quick de-escalation (target mid-April) would normalize energy markets, boost risk assets, and limit global growth to a soft patch. Prolonged closure of the Strait of Hormuz or an escalation of the war risks a global slowdown, higher global inflation, and equities testing bear-market levels. Recession odds have risen but are not the base case. US fundamentals (earnings resilience, AI capex, energy independence, and fiscal stimulus) provide a buffer. In the big picture, however, the world is changing in structural ways. Namely, we are experiencing higher interest rates, a growing trend towards fiscal dominance in monetary policy, regionalization over globalization, an emerging commodity super-cycle, and AI disruption. Pre-COVID mental models are increasingly outdated, and new paradigms must be embraced. When uncertainty spikes, human nature is to hastily protect a portfolio, but it is easy to get whipsawed in markets such as these. In contrast, Clearstead’s approach is to ensure asset allocation is reflective of goals and objectives while using market volatility as an opportunity to rebalance back to long-term targets. In the short term, and until such time when the geopolitical outlook is less murky, Clearstead is following a cautious approach in our investment activities as we plan for a new tomorrow.
Subscribe to our weekly Research Corner and other market commentary so you don’t miss our updates.
1 Bloomberg LP, 3/31/2026
2 Peter G. Peterson Foundation, National Debt Projected to Hit 175% GDP; Interest Totals $99 Trillion, 12/31/2025
3 FactSet – Earnings Insight, 4/2/2026
DISCLOSURES
Information provided is general in nature, is provided for informational purposes only, and should not be construed as investment advice. These materials do not constitute an offer or recommendation to buy or sell securities. The views expressed by the author are based upon the data available at the time the article was written. Any such views are subject to change at any time based on market or other conditions. Clearstead disclaims any liability for any direct or incidental loss incurred by applying any of the information in this article. All investment decisions must be evaluated as to whether it is consistent with your investment objectives, risk tolerance, and financial situation. You should consult with an investment professional before making any investment decision. Performance data shown represents past performance. Past performance is not an indicator of future results. Current performance data may be lower or higher than the performance data presented. Performance data is represented by indices, which cannot be invested in directly.
Related or Tagged New Posts

market perspectives
April 6th 2026
Research Corner | 4/6/2026
market perspectives
March 30th 2026
Research Corner | 3/30/2026
market perspectives
March 23rd 2026
Research Corner | 3/23/2026
market perspectives
March 16th 2026
Research Corner | 3/16/2026
market perspectives
March 9th 2026
Research Corner | 3/9/2026

market perspectives
March 2nd 2026
Impact of Escalating Conflict in Iran
market perspectives
March 2nd 2026
Research Corner | 3/2/2026
market perspectives
February 23rd 2026
Research Corner | 2/23/2026
market perspectives
February 16th 2026
Research Corner | 2/16/2026

market perspectives
February 12th 2026
Market Update | US Dollar Debasement
market perspectives
February 9th 2026
Research Corner | 2/9/2026
market perspectives
February 2nd 2026
Research Corner | 2/2/2026