OBSERVATIONS
- Markets were mixed last week, with the S&P 500 falling 0.6%, while small caps (Russell 2000) gained 1.2%. The yield on the 10-year Treasury rose 5 basis points to end the week at 4.19%.[1]
- Small business optimism edged up in November to 99.0—an increase from October’s 98.2 reading and above the long-run average of 98—and was driven by better expectations for near-term sales.[1]
- The Jobs Openings and Labor Turnover Survey (JOLTS) reported that job openings rose from 7.227 million in August to 7.658 million in September and 7.670 million in October. Meanwhile, the number of workers quitting their jobs—a measure of confidence in the labor market—increased to 3.128 million in September before declining to 2.941 million in October. The October figure marks the lowest monthly quits total since August of 2020.[1]
- Initial unemployment claims rose last week to 236k new claims, up sharply from 192,000 the week before. However, seasonal adjustments around the Thanksgiving and winter holidays can be significant, and compared to the same week last year, claims were only 4,000 higher.[1]
- The US trade deficit narrowed in September to $52.8 billion, coming in below expectations, but the impact on Q3-GDP is unclear because gold exports—excluded from GDP calculations—may have been elevated.[1]
EXPECTATIONS
- The Federal Reserve cut its main policy rate last week by 25 basis points (bps) to a range of 3.5% to 3.75%. Fed Chair Powell emphasized in the press conference that the central bank is likely to adopt a “wait and see” approach as it heads into 2026. For the first time in six years, there were three dissenting opinions—two in favor of leaving rates unchanged and one supporting a larger 50 basis point cut—which may signal more divided decisions in future Fed meetings.[1]
- Analysts currently expect the S&P 500 to deliver fourth-quarter earnings growth of 7.7% year-over-year. However, only 52 companies have issued negative earnings guidance for the quarter, below both the five and ten-year averages of 60. This lower-than-average level of negative guidance may portend another quarter of above-average earnings beats.[2]
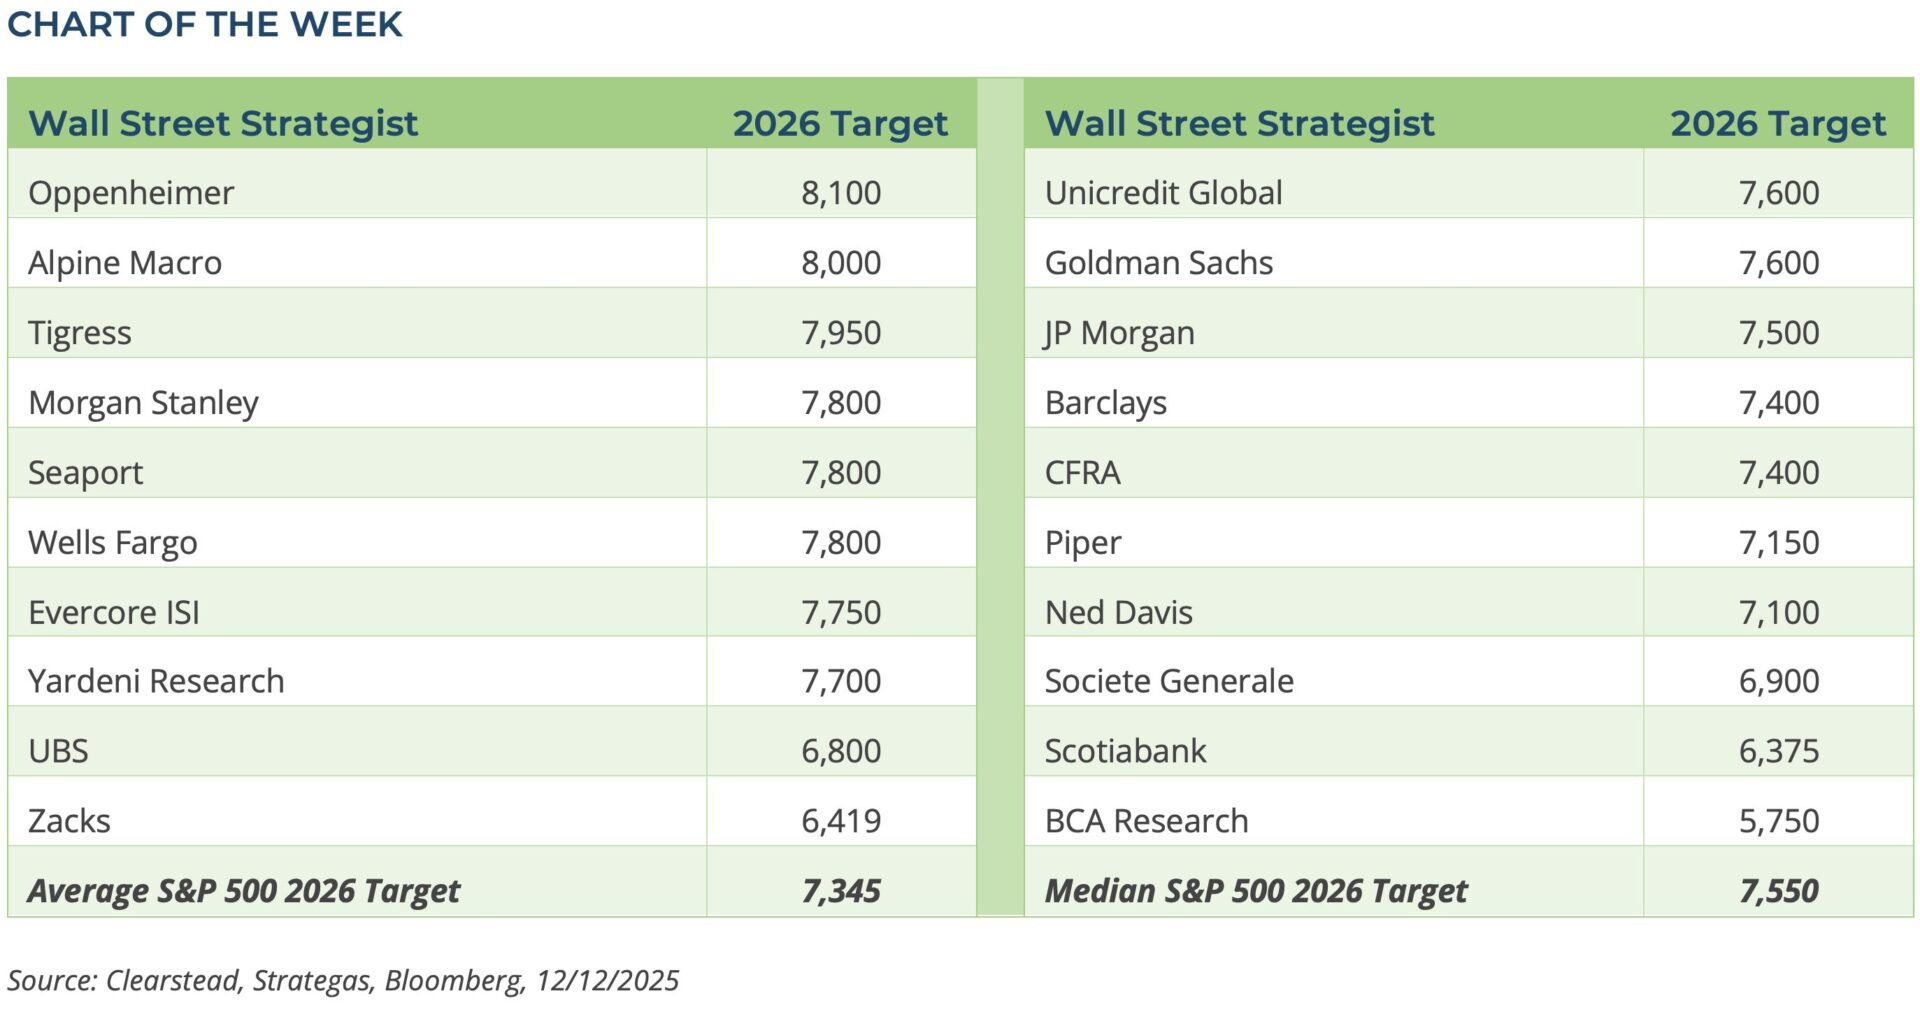
ONE MORE THOUGHT: Analysts Forecast 2026 S&P 500 Returns[1]
‘Tis the season for investment strategists to publish their S&P 500 price targets for the year ahead. It is always an interesting exercise to review these year-end targets. Do the bears (BCA Research) remain bearish, and do the bulls (Ed Yardeni) remain bullish? Has there been any major shift or capitulation? As of December 9, 2025, the average year-end 2026 S&P 500 price target was 7,345, which implies a gain of 8.7%. The range of publicized targets spans from 5,750 at the low end to 8,100 at the high end—see Chart of the Week. There may be no more difficult or thankless job than trying to predict corporate revenue growth, profit margins, and then apply an appropriate earnings multiple to those estimates. Today, consensus earnings for 2026 stand at $308. The average price target implies an earnings multiple of 24.8x. Since 2000, investment strategists have consistently underestimated market strength. Their average implied upside has been 5.1% per year, compared with the actual return of 7.7%. This is particularly notable given that S&P 500 earnings growth has been 6–7% annually over the same period. It suggests that, over all these years, strategists have not assumed the degree of multiple expansion that ultimately occurred.
Over the past 25 years, the S&P 500 has only performed worse than strategists’ estimates 31% of the time. In the years when strategists overestimated S&P 500 performance, there was always some form of “shock” — 2008 saw the Global Financial Crisis, 2001–2002 experienced the aftermath of the dot.com bubble, and 2022 was marked by the Federal Reserve’s interest rate hikes, a war in Europe, and an inflation shock. Of course, such shocks are nearly impossible to predict. Another point of interest is that there is currently greater dispersion in S&P 500 price targets than in prior years. While the forecasted appreciation of 8.7% is broadly in line with historical norms, the dispersion in forecasts is wider than usual and the most bearish in six years. Specifically, about 15% of forecasts are below the current level of the S&P 500. Historically, this bearish tilt has tended to function as an effective contrarian indicator, suggesting blue skies ahead. As we wrap up 2025, the experts are once again clustered around mid-single-digit upside while history subtly reminds us that the market’s path is typically far less tidy, and often more rewarding, than their models suggest. This year’s unusually wide and the bearish tilt to several estimates only adds fuel to the possibility that skepticism is, once again, a bull’s best friend.

[1] Bloomberg LP, 12/12/2025
[2] FactSet Earnings Insight 12/12/2025
Information provided in this article is general in nature, is provided for informational purposes only, and should not be construed as investment advice. These materials do not constitute an offer or recommendation to buy or sell securities. The views expressed by the author are based upon the data available at the time the article was written. Any such views are subject to change at any time based on market or other conditions. Clearstead disclaims any liability for any direct or incidental loss incurred by applying any of the information in this article. All investment decisions must be evaluated as to whether it is consistent with your investment objectives, risk tolerance, and financial situation. You should consult with an investment professional before making any investment decision. Performance data shown represents past performance. Past performance is not an indicator of future results. Current performance data may be lower or higher than the performance data presented. Performance data is represented by indices, which cannot be invested in directly.
Related or Tagged New Posts

market perspectives
March 30th 2026
Research Corner | 3/30/2026
market perspectives
March 23rd 2026
Research Corner | 3/23/2026
market perspectives
March 16th 2026
Research Corner | 3/16/2026
market perspectives
March 9th 2026
Research Corner | 3/9/2026

market perspectives
March 2nd 2026
Impact of Escalating Conflict in Iran
market perspectives
March 2nd 2026
Research Corner | 3/2/2026
market perspectives
February 23rd 2026
Research Corner | 2/23/2026
market perspectives
February 16th 2026
Research Corner | 2/16/2026

market perspectives
February 12th 2026
Market Update | US Dollar Debasement
market perspectives
February 9th 2026
Research Corner | 2/9/2026
market perspectives
February 2nd 2026
Research Corner | 2/2/2026
market perspectives
January 26th 2026
Research Corner | 1/26/2026