OBSERVATIONS
- Markets were mixed last week with the S&P 500 gaining 0.1% and small caps (Russell 2000) losing 0.8%, while the yield on the 10-year Treasury fell by 4 basis points to end the week at 4.15%.[1]
- Retail sales for October were largely unchanged month-over-month (MoM) from September. However, excluding the volatile auto and gas segments, retail sales increased by 0.5% MoM. The retail sales control group—the cohort of sales that informs GDP estimates—increased by 0.8% MoM, ahead of expectations.[1]
- Inflation figures came in better than expected in November, with the headline CPI falling to 2.7% year-over-year (YoY) from September’s 3.0% YoY figure. Core CPI—which removes the volatile food and energy categories—fell to 2.6% YoY from September’s 3.0% YoY. The government shutdown has precluded the publishing of CPI data for October and November’s figures are in question due to product coverage gaps.[1]
- Existing home sales increased 0.5% MoM to 4.13 million (annualized rate) in November from October’s 4.11 million. Compared to Nov-2024, existing home sales were down 1.0%.[1]
- Initial unemployment claims remain low, registering 224k last week, which is a decrease of 13k from the week prior, and on par with claims from the same week last year.[1]
- The jobs report for both October (partial) and November were released last week and showed a US labor market that is increasingly fragile. The August and September jobs numbers were revised lower by -26k and 108k, respectively. The initial estimate for October is that the economy shed -105k jobs—driven by a 162k drop in federal government employees—but in November the economy created 64k new jobs. From August to November, the economy created only 41k total new jobs. The unemployment rate in November climbed to 4.6%, the highest rate since Oct-2021, but largely due to labor force participation inching up.[1]
EXPECTATIONS
- In another close vote, the Bank of England decided to reduce its main policy rate by 25 basis points (bps) to 3.75% in response to weakening growth. Meanwhile, the European Central Bank (ECB) kept its main policy rate unchanged at 2.0%, signaling that it would hold rates steady as inflationary pressures eased further and economic growth remained stable.[1]
- In contrast, the Bank of Japan raised its main policy rate by 25 bps to 0.75%—a 30-year high—signaling a willingness to increase rates further in 2026 should inflationary pressures persist.[1]
- Currently, the Fed Fund Futures markets have priced in a 60% probability that the Federal Reserve cuts rates by a further 25 bps in Q1-2026.[1]
Research Corner will take a break for the winter holidays and return on Monday, January 5, 2026. Happy Holidays!
ONE MORE THOUGHT: Taking Stock of 2025 – A Good Year[1]
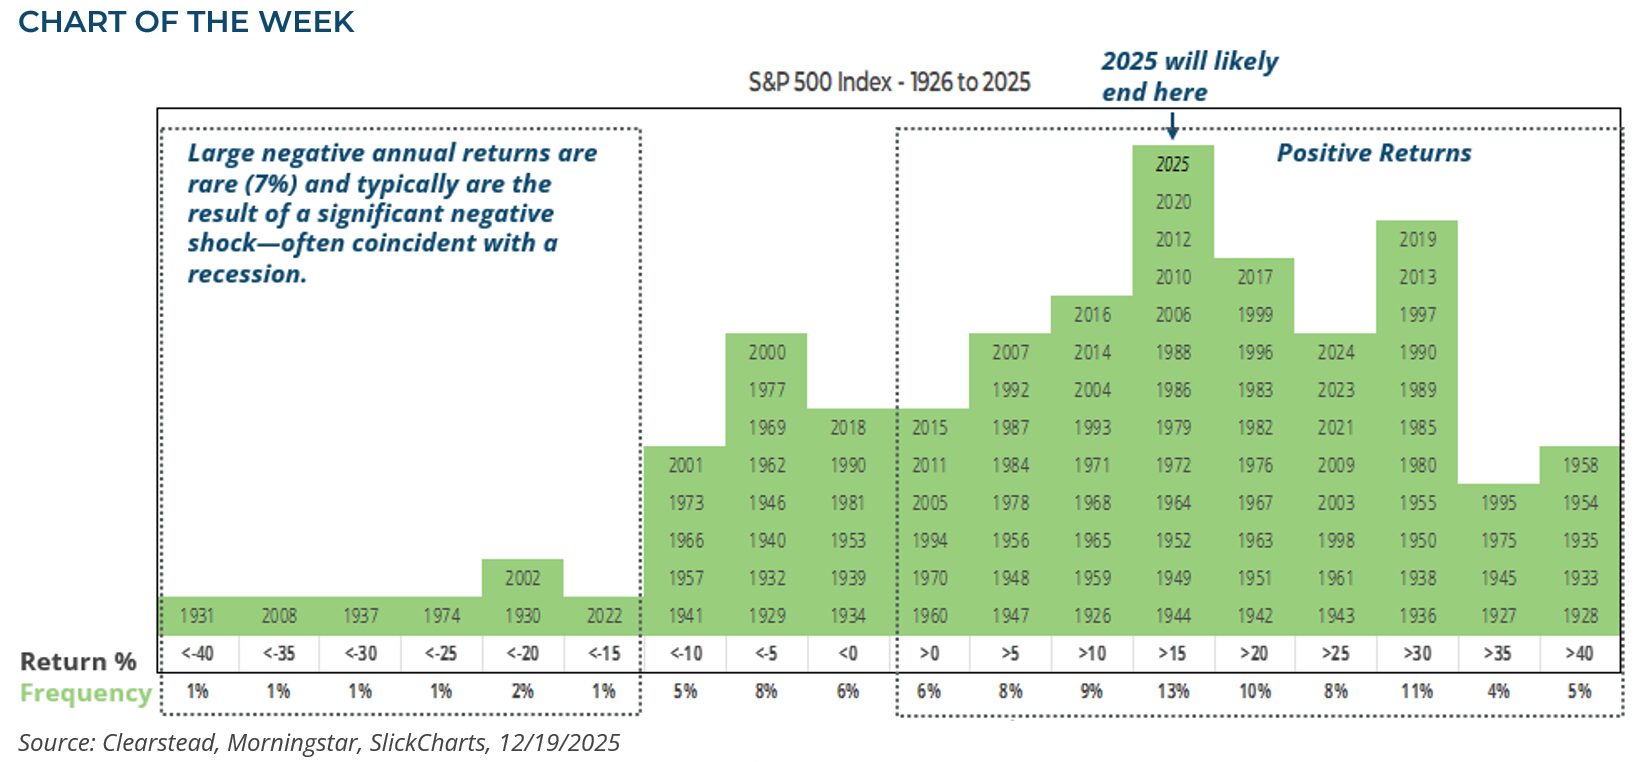
With only about a week of trading left this year, it is safe to conclude that 2025 was a good year for markets. The S&P 500 is likely to end the year at around 6,800, which would mark an annual return of around 17%, while the Bloomberg Aggregate Bond Index is set to return over 7%. This year was not without its challenges. The first 100 days of the Trump administration ushered in a new global trading framework for the corporate sector, structurally curtailed net immigration, and provided a new tax and spending framework that will dominate for several years. In early April, at the height of the worries over tariffs, the S&P 500 had lost -15% (YTD 4/8), and the prospect of a recession in the latter part of the year seemed unavoidable. In the end, the Trump administration suspended the highest tariff rates, and US firms managed their supply chains to preserve margins and maintain sales. The result was a year of strong profits and a stable economy throughout the final months of the year. As we head into 2026, it is easy to paint a bearish picture—an economy that looks increasingly weak, stretched equity valuations, a potential AI-stock bubble, and three-straight years of robust returns (2023 +26%, 2024 +25%, 2025 ≈+17%). Some may think that given this backdrop, the S&P 500 is set up to deliver poor returns, particularly because next year will feature a midterm election—typically the weakest year within a 4-year presidential cycle. As we look out over the investment landscape, Clearstead is reminded that the consensus estimates for next year’s corporate profits look solid and that a broader set of companies look likely to prosper. Global liquidity is not under stress, and the US labor market remains stable. Our baseline outlook is that, absent a significant negative shock, markets typically grind higher—see Chart of the Week. Bull markets can persist for multiple years and are typically derailed when euphoria and leverage give way to reality and tighter liquidity. At present, there does not seem to be egregious levels of investor complacency, and the fundamental backdrop to next year’s investment landscape should be supportive of further gains.

[1] Bloomberg LP 12/19/2025
Information provided in this article is general in nature, is provided for informational purposes only, and should not be construed as investment advice. These materials do not constitute an offer or recommendation to buy or sell securities. The views expressed by the author are based upon the data available at the time the article was written. Any such views are subject to change at any time based on market or other conditions. Clearstead disclaims any liability for any direct or incidental loss incurred by applying any of the information in this article. All investment decisions must be evaluated as to whether it is consistent with your investment objectives, risk tolerance, and financial situation. You should consult with an investment professional before making any investment decision. Performance data shown represents past performance. Past performance is not an indicator of future results. Current performance data may be lower or higher than the performance data presented. Performance data is represented by indices, which cannot be invested in directly.
Related or Tagged New Posts

market perspectives
March 16th 2026
Research Corner | 3/16/2026
market perspectives
March 9th 2026
Research Corner | 3/9/2026

market perspectives
March 2nd 2026
Impact of Escalating Conflict in Iran
market perspectives
March 2nd 2026
Research Corner | 3/2/2026
market perspectives
February 23rd 2026
Research Corner | 2/23/2026
market perspectives
February 16th 2026
Research Corner | 2/16/2026

market perspectives
February 12th 2026
Market Update | US Dollar Debasement
market perspectives
February 9th 2026
Research Corner | 2/9/2026
market perspectives
February 2nd 2026
Research Corner | 2/2/2026
market perspectives
January 26th 2026
Research Corner | 1/26/2026
market perspectives
January 20th 2026
Research Corner | 1/20/2026
market perspectives
January 12th 2026
Research Corner | 1/12/2026