OBSERVATIONS
- Equity markets were choppy and traded lower last week with the S&P 500 losing 1.4%, while small caps (Russell 2000) fell by 0.9% and the yield on 10-year Treasury fell 16 basis points to end the week at 4.05%.[1]
- Small business optimism fell modestly in January to 99.3 from December’s 99.5 reading but remains above its 52-week average of 98. Some of the decline in the index was driven by business owners reporting greater uncertainty about whether it was a good time to expand their business.[1]
- Retail sales came in lighter than expected for December (latest available). The headline retail sales number showed no increase from November—consensus was for a 0.4% month-over-month (MoM) increase—while retail sales excluding the volatile auto and gasoline categories also showed no increase in December.[1]
- Inflation came in better than expected in January, with the headline CPI falling to 2.4% year-over-year (YoY)—expectations were for 2.5% YoY—from December’s 2.7% YoY figure. Core-CPI, which removes the volatile food and energy items, also eased in January, falling to 2.5% YoY rate from December’s 2.6% YoY.[1]
- Existing home sales disappointed in January, falling to 3.91 million (annualized rate). This was below expectations and an 8.4% MoM decrease from the December existing home sales rate of 4.27 million.[1]
- Initial unemployment claims were 227k, which was about 5k lower than the week prior but above expectations. Compared to the same week last year, initial claims were about 15k higher and have been averaging 15k claims above the corresponding week last year since the beginning of 2026.[1]
- The delayed-January jobs report showed that the labor market has fared better than expected so far in 2026. The economy created 130k new jobs—almost double expectations—and the unemployment rate fell to 4.3%. Both the hours worked and the participation rate ticked slightly higher.[1]
EXPECTATIONS
- Expectations for upcoming Fed action have changed modestly, considering the upbeat jobs report, with Fed Fund Futures now pricing in a 85% chance of a 25-basis point rate cut in June. Before the January jobs figures were released, the market had been pricing in a 98% chance of a rate cut by June. Nonetheless, the markets still expect a rate cut by the Fed meeting in July at the latest.[1]
- So far, about 74% of S&P 500 constituents have reported, and approximately 74% have had a positive surprise. This is below the 5-year (78%) and 10-year (76%) average for beats. Overall, Q4 earnings are tracking towards an impressive increase of 13.2% YoY.[2]
ONE MORE THOUGHT: BLS Makes Major Revisions to Its Jobs Numbers[3]
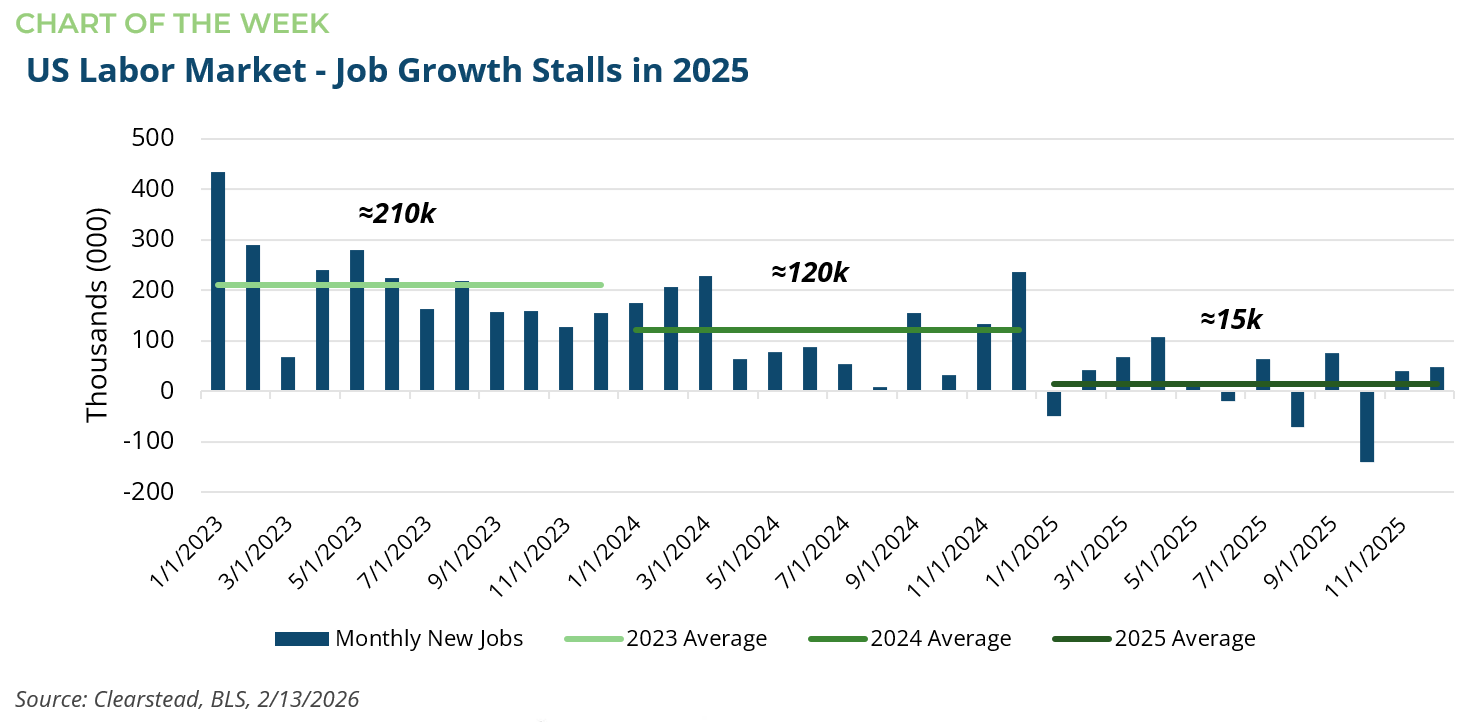
In addition to the January jobs report, the Bureau of Labor Statistics (BLS) released two major revisions to the official jobs data last week. The first revision related to the BLS’s final numbers concerning its annual QCEW jobs revision—which reconciles the initial job estimates based on surveys of businesses with actual payroll tax information—for the period April-2024 to March-2025. The final QCEW numbers showed that the total jobs created during that period was lower by 898k jobs (the initial estimate was a 910k decrease see RC 15-Sep). This annual revision is standard, with the initial QCEW revision published every September and then finalized the following February. However, in recent years, the QCEW revisions have been large and almost always negative, which suggests a structural tendency to overestimate job creation. This has prompted the BLS to revise the so-called birth-death model. This model estimates employment based on the payroll survey, particularly the portion of the model designed to account for both new businesses being formed and businesses being shuttered. As a reminder, the monthly jobs figures are based on the BLS monthly payroll survey of 120,000 firms, which has seen less than a 40% initial response rate in recent years. In contrast, QCEW revisions come from data around unemployment insurance and payroll taxes for over 12 million businesses. Thus, the QCEW data—which is only available after a several-month lag—provides a much more accurate estimate as to how many actual jobs were created in any given period. The net result of these two revisions, the normal QCEW revisions, as well as the updates/tweaks to the BLS’s birth-death model, is lower estimates of total job creation over the past two years. For instance, with new revisions, the economy created only 15k new jobs per month in 2025, down from the initial estimate of nearly 50k new jobs per month in 2025. In total, the BLS estimates that the economy created only about 180k new jobs during all of 2025, as compared to the initial estimate of 580k. We consider US labor market data critical to the understanding of the broad economy and, thus far, despite anemic job growth last year, the labor market remains stable. So long as layoffs don’t materially increase, the economy can continue to expand even if job seekers and new college grads take longer to find employment.

[1] Bloomberg LP, 1/30/2026
[2] FactSet Earnings Insight 1/30/2026
[3] https://www.bls.gov/news.release/empsit.nr0.htm
Information provided in this article is general in nature, is provided for informational purposes only, and should not be construed as investment advice. These materials do not constitute an offer or recommendation to buy or sell securities. The views expressed by the author are based upon the data available at the time the article was written. Any such views are subject to change at any time based on market or other conditions. Clearstead disclaims any liability for any direct or incidental loss incurred by applying any of the information in this article. All investment decisions must be evaluated as to whether it is consistent with your investment objectives, risk tolerance, and financial situation. You should consult with an investment professional before making any investment decision. Performance data shown represents past performance. Past performance is not an indicator of future results. Current performance data may be lower or higher than the performance data presented. Performance data is represented by indices, which cannot be invested in directly.
Related or Tagged New Posts

market perspectives
March 30th 2026
Research Corner | 3/30/2026
market perspectives
March 23rd 2026
Research Corner | 3/23/2026
market perspectives
March 16th 2026
Research Corner | 3/16/2026
market perspectives
March 9th 2026
Research Corner | 3/9/2026

market perspectives
March 2nd 2026
Impact of Escalating Conflict in Iran
market perspectives
March 2nd 2026
Research Corner | 3/2/2026
market perspectives
February 23rd 2026
Research Corner | 2/23/2026

market perspectives
February 12th 2026
Market Update | US Dollar Debasement
market perspectives
February 9th 2026
Research Corner | 2/9/2026
market perspectives
February 2nd 2026
Research Corner | 2/2/2026
market perspectives
January 26th 2026
Research Corner | 1/26/2026
market perspectives
January 20th 2026
Research Corner | 1/20/2026