OBSERVATIONS
- Markets traded modestly higher last week with the S&P 500 gaining +1.5%, while small caps (Russell 2000) gained only +0.1% and the yield on the 10-year Treasury was little changed (-1 basis point) at 4.48%.[1]
- The Small Business Optimism Index fell to 102.8 in January from December’s 105.1 but remains positive and is above its 50-year average (98) for the third consecutive month even as uncertainty has increased due to the new Trump administration aggressive roll out of new policies.[1]
- Headline inflation (CPI) came in higher than expected in January and increased to 3.0% year-over-year (YoY) from December’s 2.9% YoY level. Core-CPI, which strips out volatile food and energy, also came in higher than expected in January rising to 3.3% YoY, which was higher than December’s 3.2% YoY figure.[1]
- Producer prices also increased more than expected with the headline PPI index coming in at 3.5% YoY in January. Similarly, core-PPI, which excludes food and energy, was 3.6% YoY in January, which was lower than December’s figure but only after December’s figure was revised higher to 3.7% YoY.1
- Initial unemployment claims remain low falling -7k last week from the week prior to 213k new claims.[1]
- Industrial production increased +0.5% month-over-month (MoM) in January and capacity utilization climbed to 77.8%—both slightly ahead of expectations—and industrial production for December was revised higher.[1]
- Retail sales, in contrast, contracted by -0.9% MoM—more than analysts expected—while retail sales excluding volatile autos and gas purchases also fell by -0.5% MoM where consensus expected a small gain.[1]
EXPECTATIONS
- Despite the higher CPI inflation prints, expectations for Fed action later this year did not shifted materially. Before the inflation numbers, markets had priced in an 80% chance that the Fed would cut rates by 25 basis points in July and projected about a 50% chance of a second cut of the same amount by December. After the CPI release, the probability of a July cut was the same and the probability of a second cut had risen to 60%.[1]
- So far, 77% of the S&P 500 has reported Q4 earnings and 76% have reported a positive earnings surprise which is in between the 5-year (77%) and 10-year (75%) averages for earnings surprises. The blended EPS growth for Q4-2024 is 16.9% YoY, which is the highest YoY EPS growth rate since Q4-2021.[2]
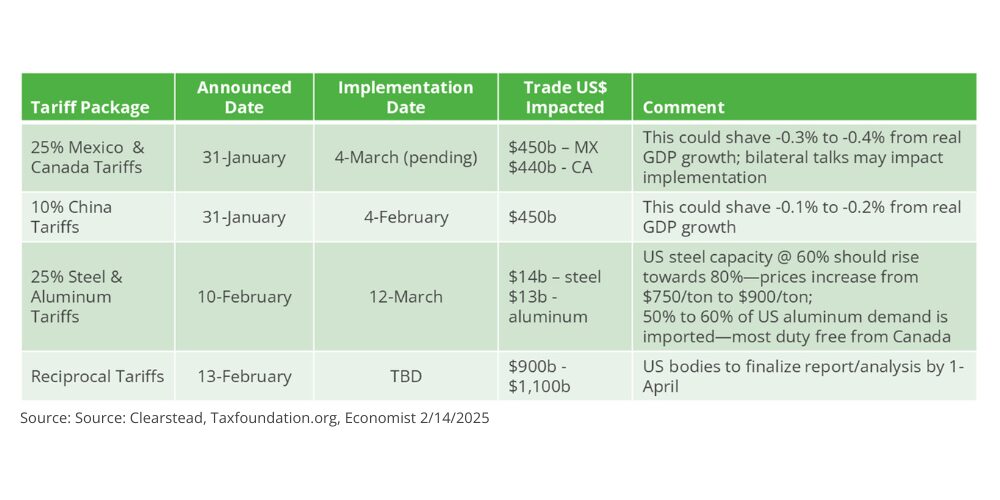
ONE MORE THOUGHT: New Tariffs on Steel and Aluminum and Looming Reciprocal Tariffs[3]
In less than a month in office, the Trump administration has imposed a 10% tariff on nearly $500 billion in Chinese imports. Last week he announced new 25% tariffs on all steel and aluminum imports effective 1-March. He also directed federal agencies to study how to raise US tariffs to match existing tariffs and certain economic barriers (typically import quotas) used by other nations to restrict US exports to their country. The economic impact of these new tariff policies is becoming clearer as the details become clearer. So far, most analyses of the impact of the Chinese tariffs remain small. In part, this is because the Chinese Renminbi has depreciated against the dollar and has muted some of the impact of the tariff. The Tax Foundation study found that the Chinese tariffs would likely cut US growth by -0.1% annually. However, the impact from the steel and aluminum tariffs are likely to have a larger impact, if enacted at the level and scope—no countries steel exports to the US exempted—as announced. History provides good evidence of what happens to steel prices after tariffs are implemented. In 2002, then President Bush passed tariffs on imported steel ranging from 8% to 30% for two years and steel prices rose and the downstream industries that used steel to manufacture products saw declines in margins, profitability, and the ability to compete in foreign markets. Worse, once the tariffs were removed in 2003, the market share losses by US firms persisted even after the tariffs were removed and steel prices returned to pre-tariff levels. Because there are many more steel-consuming than steel-producing industries in the US, the 2001 tariffs likely lowered manufacturing employment between -50,000 to -200,000 total jobs. Similarly, an analysis of the 2017 steel tariffs imposed by Trump in his first term may have created 1,000 jobs in the steel sector—US steel production and capacity utilization did rise in 2018-2019 after the tariffs were imposed—but may have cost -75,000 jobs in the broader manufacturing sector which experienced rising input costs. Aluminum tariffs are likely even more costly in that the US has only a limited ability to quickly increase aluminum production, and if the US aluminum industry thinks the tariffs are temporary, they may not opt to make investments to increase production capacity. At least half of all aluminum used is imported—primarily from Canada—and Ford and GM indicated that the 2017 tariffs on aluminum ended up in cars costing $700 more per vehicle on average. There was also some evidence that US bottlers either shifted to more plastic containers or raised prices marginally to offset the increase in their input cost for aluminum cans. The broad-based 25% tariffs on all Mexican and Canadian imports have been delayed until March 4th but are still in play. The other announcement that the US will raise tariffs on numerous parts of the world commensurate with their trade tariffs and other trade restrictions may further raise the prices of imported goods from places like Vietnam, India, Thailand, Brazil, and Argentina. While this may be a tactic by the Trump administration to seek better terms-of-trade for US exporters, but unless these countries back-down and lower their trade barriers it will only result in higher US prices for select goods.
CHART OF THE WEEK

[1] Bloomberg LP, 2/14/2025
[2]https://advantage.factset.com/hubfs/Website/Resources%20Section/Research%20Desk/Earnings%20Insight/EarningsInsight_021425.pdf
[3] The Long-Term Impact of Steel Tariffs on U.S. Manufacturing” L. Cox Feb-2023, Princeton; https://taxfoundation.org /section-232-tariffs-steel-aluminum/
DISCLOSURES: Information provided in this article is general in nature, is provided for informational purposes only, and should not be construed as investment advice. These materials do not constitute an offer or recommendation to buy or sell securities. The views expressed by the author are based upon the data available at the time the article was written. Any such views are subject to change at any time based on market or other conditions. Clearstead disclaims any liability for any direct or incidental loss incurred by applying any of the information in this article. All investment decisions must be evaluated as to whether it is consistent with your investment objectives, risk tolerance, and financial situation. You should consult with an investment professional before making any investment decision. Performance data shown represents past performance. Past performance is not an indicator of future results. Current performance data may be lower or higher than the performance data presented. Performance data is represented by indices, which cannot be invested in directly.
Related or Tagged New Posts

market perspectives
March 16th 2026
Research Corner | 3/16/2026
market perspectives
March 9th 2026
Research Corner | 3/9/2026

market perspectives
March 2nd 2026
Impact of Escalating Conflict in Iran
market perspectives
March 2nd 2026
Research Corner | 3/2/2026
market perspectives
February 23rd 2026
Research Corner | 2/23/2026
market perspectives
February 16th 2026
Research Corner | 2/16/2026

market perspectives
February 12th 2026
Market Update | US Dollar Debasement
market perspectives
February 9th 2026
Research Corner | 2/9/2026
market perspectives
February 2nd 2026
Research Corner | 2/2/2026
market perspectives
January 26th 2026
Research Corner | 1/26/2026
market perspectives
January 20th 2026
Research Corner | 1/20/2026

market perspectives
January 12th 2026
Quarterly Market Insights | 4Q25