Observations
- Markets traded flat last week even as the Fed left open the possibility of some rate cuts later in the year (see Expectations). The S&P 500 gained +0.5% and small caps (Russell 2000) gained +0.7%, while the yield on the 10-year Treasury fell -6 basis points to 4.25%.[1]
- Retail sales came in weaker in February than expected—+0.2% month-over-month (MoM) vs. the consensus of +0.6% MoM—and the decline in retail sales in January was revised to be more severe, suggesting that the US consumer is being cautious in light of uncertain economic outlook.[1]
- Industrial production rose +0.7% MoM in February, which was better than expected, and capacity utilization increased to 78.2 last month from January’s 77.7% figure. Industrial production was boosted by a rebound in automotive production and mining activity largely in the oil and gas sectors.[1]
- New housing starts increased in February to 1.501 million (annualized rate) up from January’s 1.385 million. February’s increase in housing starts represents +11.2% MoM increase, but February’s new home starts are still -2.9% lower than new housing starts from a year prior in Feb-2024.[1]
- Existing home sales increased to 4.26 million (annualized rate) in February from January’s 4.09 million figure, but remain -1.2% lower year-over-year compared to Feb-2024.[1]
- Unemployment claims rose only +3k last week to 223k new claims—claims are running about +10% above last year’s claims for this time of year, which were some of the lowest on record since 1970.[1]
Expectations
- The US Federal Reserve met last week and made no changes to interest rates. The Fed noted that the Trump administration’s emerging tariff policy had created heightened uncertainty for the remainder of the year in terms of the economic outlook. The Fed emphasized that the tariff policy had increased the likelihood of slowing economic growth and higher inflation for the remainder of the year, and the Fed would not adjust interest rates until it gained greater clarity on the fuller impact of these tariff policies, but the Fed still left open the possibility of as many as two rate cuts later in the year if inflation continues to cool.[1]
- The Bank of Japan (BoJ) also held rates steady last week at 0.5% noting that while inflation is still a concern, in part due to food prices, that an uncertain growth outlook due to the emerging US tariff policy required that the BoJ proceed with caution on any further rate hikes so as not to undermine economic growth.[2]
- Similarly, the Bank of England also held rates steady last week citing uncertainty over its economic outlook.[1]
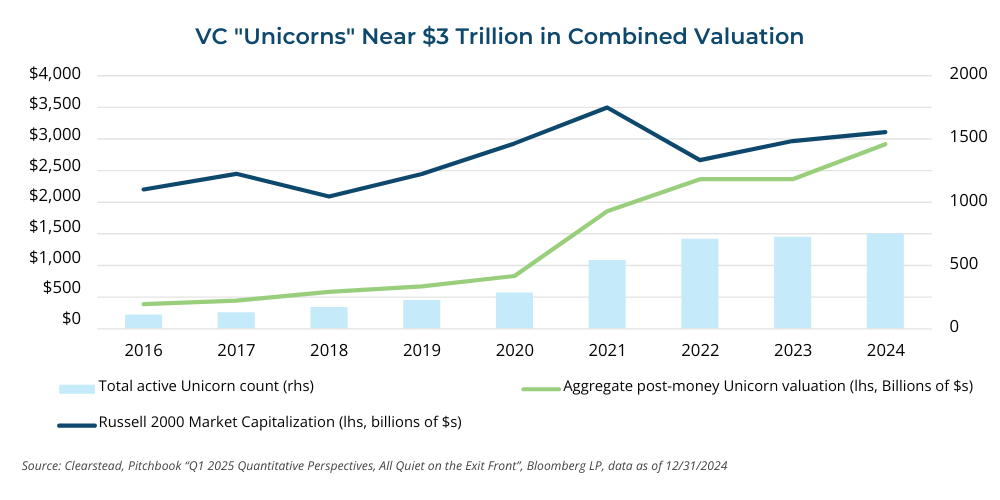
One More Thought: Venture Capital Unicorns reach a combined value of nearly $3 trillion.[3]
Venture Capital (VC) backed Unicorns, those companies with valuations in excess of $1 billion, now nearly matches the market capitalization of the Russell 2000 small cap index of publicly traded companies. Over 750 Unicorns represent aggregate post-money valuations of $2.9 trillion, while the Russell 2000 index claims a market capitalization of $3.1 trillion as of 12/31/2024, respectively (see Chart of the Week). To be clear, this may not be the most appropriate benchmark when comparing VC universe to public markets but serves more an interesting observation given today’s markets. Artificial Intelligence hype has been a significant driver of venture capital in recent years and in 2024 the top 20 VC deals accounted for 31% of total venture capital invested, anchored by AI sweethearts Databricks, OpenAI, xAI, and Anthropic. In 2024, AI represented nearly half of all US VC investment activity, up from about a quarter of all VC activity in 2022. Not surprisingly, the big continue to get bigger with just 30 VC funds accounting for 75% of all venture dollars raised in 2024. Overall interest in AI is not for just speculative hype reasons as AI startups have scaled from $1mm to $30mm in revenue five times faster than traditional SaaS (Software as a Service) companies. Unicorns also appear to remain in the hands of private markets for longer as nearly 65% of all Unicorns raised their first VC round at least 7 years ago, certainly one reason why we see the aggregate value of Unicorns where it is today. Add to this the dearth of US VC IPO activity, which last year saw just $7 billion in VC IPOs, and it is not too surprising we are where we are. So, is the fact that VC Unicorns are as large as the entire small cap markets a harbinger of bad things to come or simply a reflection of where the economy’s growth and ingenuity for the next decade plus are likely to come from? We would be more aligned with the latter but would expect very few winners and many losers—reinforcing the importance of investing with the most skilled venture managers. Ultimately, as IPO and M&A activity increases, the public markets, small cap included, may shift to reflect these emerging AI companies that are expected to power the economy in the years ahead.
Chart of the Week

[1] Bloomberg LP
[2] https://www.ft.com/content/79f17527-7f56-4030-8f51-1abd0f7718d3
[3] 2025 Stepstone Venture and Growth Annual Meeting (February 2025), Pitchbook “Q1 2025 Quantitative Perspectives, All Quiet on the Exit Front,” Bloomberg LP
Information provided in this article is general in nature, is provided for informational purposes only, and should not be construed as investment advice. These materials do not constitute an offer or recommendation to buy or sell securities. The views expressed by the author are based upon the data available at the time the article was written. Any such views are subject to change at any time based on market or other conditions. Clearstead disclaims any liability for any direct or incidental loss incurred by applying any of the information in this article. All investment decisions must be evaluated as to whether it is consistent with your investment objectives, risk tolerance, and financial situation. You should consult with an investment professional before making any investment decision. Performance data shown represents past performance. Past performance is not an indicator of future results. Current performance data may be lower or higher than the performance data presented. Performance data is represented by indices, which cannot be invested in directly.
Related or Tagged New Posts

market perspectives
March 16th 2026
Research Corner | 3/16/2026
market perspectives
March 9th 2026
Research Corner | 3/9/2026

market perspectives
March 2nd 2026
Impact of Escalating Conflict in Iran
market perspectives
March 2nd 2026
Research Corner | 3/2/2026
market perspectives
February 23rd 2026
Research Corner | 2/23/2026
market perspectives
February 16th 2026
Research Corner | 2/16/2026

market perspectives
February 12th 2026
Market Update | US Dollar Debasement
market perspectives
February 9th 2026
Research Corner | 2/9/2026
market perspectives
February 2nd 2026
Research Corner | 2/2/2026
market perspectives
January 26th 2026
Research Corner | 1/26/2026
market perspectives
January 20th 2026
Research Corner | 1/20/2026

market perspectives
January 12th 2026
Quarterly Market Insights | 4Q25