OBSERVATIONS
- Equity markets slid last week with the S&P 500 losing -1.0% and small caps (Russell 2000) falling -1.5%, while bonds rallied and the yield on the 10-year Treasury fell -22 basis points to end the week at 4.21%.[1]
- The S&P CoreLogic National Home Price Index increased +3.9% year-over-year (YoY) in January, which was modestly higher from December’s +3.7% YoY figure.[1]
- New home sales fell by -10.5% month-over-month (MoM) to 657k (annualized rate) in January down from December’s 734k new home sales rate.[1]
- The Conference Board’s measure of consumer confidence declined for the third consecutive month falling by 7.0 points—the largest monthly decline since mid-2021—to 98.3 due to concerns over inflation and the future state of the economy, but it remains above the 50-year average of 95.4.[1]
- Durable goods orders jumped by +3.1% MoM in January—beating expectations—and even excluding defense shipments and aircraft orders still increased +0.8% MoM, which was also better than expected.[1]
- Initial unemployment claims increased to 242k—a 22k increase from the week prior and more than consensus expectations—and, in part, reflect heightened initial claims in the greater Washington-DC area.[1]
- The Fed’s preferred inflation measure, the PCE Price Index showed that both headline PCE inflation and core-PCE inflation—removing volatile food and energy prices—eased in January in line with expectations. Headline PCE fell to 2.5% YoY down from December’s 2.6% YoY figure and core-PCE fell to 2.6% YoY down from 2.9% YoY the month prior.[1]
EXPECTATIONS
- China’s annual “Two Sessions” policy meetings begin this week, and Beijing will look to reinforce some key economic themes for 2025. These policy meetings will set the formal goals for the year and will likely announce an economic growth goal of about 5% YoY as well as reforms aimed at bolstering China’s AI-oriented firms, supporting the beleaguered property market, and fiscal spending to support the creation of 1 million new jobs per month.[2]
- With almost 97% of the S&P having reported Q4 earnings, 75% of firms had a positive earnings surprise—on-par with the 10-year average (75%) but behind the 5-year average (77%)—while Q4 earnings growth for the index ended up at +18.2% YOY, which is the best quarterly earnings growth since Q4-2021.[3]
ONE MORE THOUGHT: Seasonality, Correction Concerns, and a Growth Scare[1]
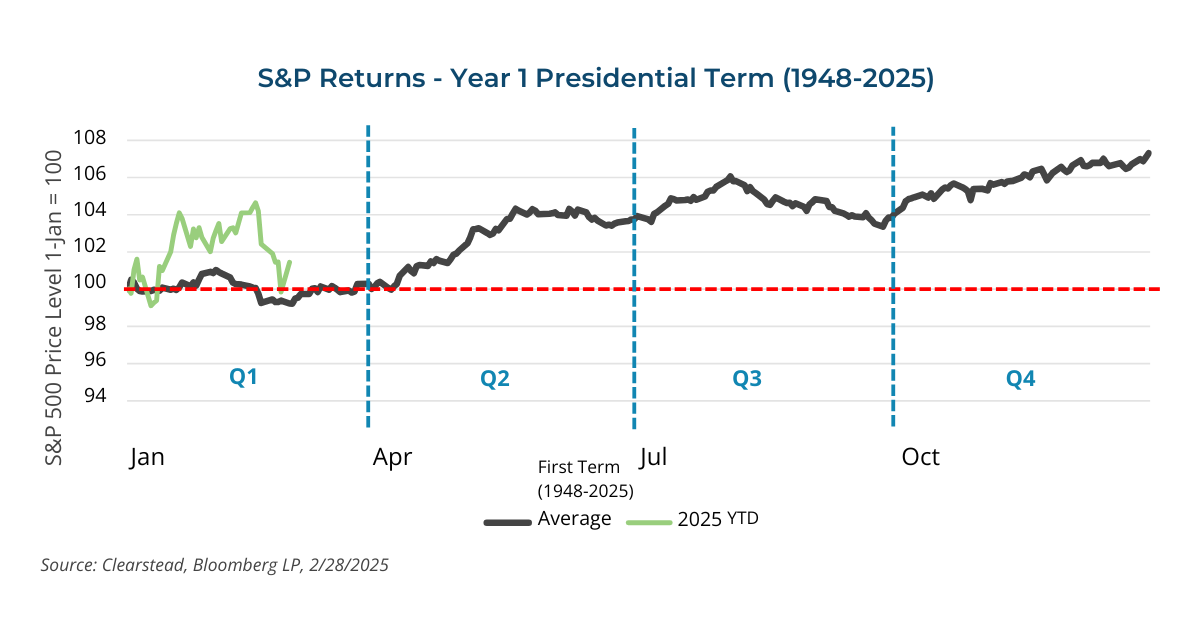
US equity markets broadly declined last week. In fact, the decline through last Thursday capped off the worst 6-day stretch for the S&P 500 since the year began. The S&P 500 lost -4.6% from Wednesday 19-Feb to Thursday 27-Feb, while small caps (Russell 2000) performed even worse declining for seven of the eight trading days through last Thursday and losing -6.6%. Until last week, the VIX Index—the so-called Fear Index—has traded well below its long-run average of 19.5 and has averaged about 16.7 since the beginning of year, despite all the policy uncertainty coming out of Washington regarding tariffs, taxes, and immigration reform. Some of the recent weakness in the stock market stems from fears that the US economy may be slowing down. Recent purchasing manager surveys suggest that growth in the service sector is weakening, and the manufacturing sector has been relatively weak for the past 18 months. Similarly, the most recent retail sales numbers suggested the US consumer may be curtailing some spending in light of sticky inflation and a less robust jobs market. As a result, the Atlanta Fed’s GDPNow model—a real-time estimate of economic growth—fell from 3.8% growth in early February to an estimate of -1.5% growth at present. This has sparked some discussion that a correction—more than a -10% decline in equities—may be in the works. In fact, small cap stocks have actually declined more than -11% since their mid-Nov 2024 high and are in a formal correction. Meanwhile, the S&P 500 has not seen an intra-year decline of more than 10% since a turbulent period from September to October 2023. Intra-year, corrections in equities, including the S&P 500, are normal and often set the stage for further gains. Also, when looking at the return dynamics of the S&P 500 at the beginning of a new Presidential term—see Chart of the Week—one finds that on average the returns in the first quarter are typically close to zero but move higher (on average) in the second quarter and fourth quarter of the year. As we noted in our 2025 outlook, after back-to-back gains of over 20% in 2023 and 2024, we judged that 2025 would likely be a year of modest gains in the S&P 500 and the path to those gains would be choppy. As volatility picks up, investors can take comfort in the fact that in only eight instances out of twenty has the S&P 500 ended the first year of President’s 4-year term in the red. Also, in all eight negative Presidential first-year returns the S&P 500 showed a negative return in the first quarter. Thus, if history is any guide and the S&P 500 can find its footing in March and avoid a further drawdown, the outlook for better days to come for US equities looks intact.
CHART OF THE WEEK

Information provided in this article is general in nature, is provided for informational purposes only, and should not be construed as investment advice. These materials do not constitute an offer or recommendation to buy or sell securities. The views expressed by the author are based upon the data available at the time the article was written. Any such views are subject to change at any time based on market or other conditions. Clearstead disclaims any liability for any direct or incidental loss incurred by applying any of the information in this article. All investment decisions must be evaluated as to whether it is consistent with your investment objectives, risk tolerance, and financial situation. You should consult with an investment professional before making any investment decision. Performance data shown represents past performance. Past performance is not an indicator of future results. Current performance data may be lower or higher than the performance data presented. Performance data is represented by indices, which cannot be invested in directly.
[1] Bloomberg, LP 2/28/2025
[2] Goldman Sachs – China: “Two Sessions” Preview: Fiscal Expansion Underway to Stabilize Growth, 2/20/2025
[3] FactSet Earnings Insight 2/28/2025
Related or Tagged New Posts

market perspectives
March 16th 2026
Research Corner | 3/16/2026
market perspectives
March 9th 2026
Research Corner | 3/9/2026

market perspectives
March 2nd 2026
Impact of Escalating Conflict in Iran
market perspectives
March 2nd 2026
Research Corner | 3/2/2026
market perspectives
February 23rd 2026
Research Corner | 2/23/2026
market perspectives
February 16th 2026
Research Corner | 2/16/2026

market perspectives
February 12th 2026
Market Update | US Dollar Debasement
market perspectives
February 9th 2026
Research Corner | 2/9/2026
market perspectives
February 2nd 2026
Research Corner | 2/2/2026
market perspectives
January 26th 2026
Research Corner | 1/26/2026
market perspectives
January 20th 2026
Research Corner | 1/20/2026

market perspectives
January 12th 2026
Quarterly Market Insights | 4Q25