OBSERVATIONS
- Markets were mixed last week and were buoyed, in part, by the start of US-Iranian negotiations. The S&P 500 lost 2.1%, but small caps (Russell 2000) gained 0.5%, and the yield on the 10-year Treasury rose 5 basis points to end the week at 4.43%.[1]
- US construction spending fell in January -0.3% month-over-month (MoM) as compared to construction spending in December 2025. Both residential (-0.8% MoM) and commercial (-0.4% MoM) construction fell in January. In contrast, public construction increased in January by 0.6% MoM.[1]
- Productivity gains eased last quarter, with non-farm productivity falling to 1.8% quarter-over-quarter (QoQ) in Q4-2025 from Q3’s 2.8% productivity rate. The fall in productivity was largely due to higher-than-expected unit labor costs, which increased in Q4 to 4.4% QoQ from Q3’s 2.8% QoQ rate.[1]
- Import prices increased in February by 1.3% MoM, well ahead of expectations (0.6% MoM). This marked the largest monthly increase for import prices in nearly 4 years.[1]
- Initial unemployment claims remain low, increasing by 5k from the week prior to 210k, and claims were 14k lower than the same week last year.[1]
EXPECTATIONS
- March presented investors with a “one-factor” market, as oil prices drove an inverse response in equity markets. Starting in mid-February as tensions in the Middle East mounted, the correlation between oil prices (WTI) and S&P 500 returns became markedly negative (-0.5), and there have been only six trading days since 16-Feb where oil prices and the S&P 500 have moved in the same direction.[1]
- S&P sector movements in March so far are, in short, confusing, with defensive sectors like Healthcare and Consumer Staples delivering some of the worst performance. Whereas the Energy sector (unsurprisingly) was the best performer, up 12.6%, outperforming the Healthcare sector (-10.2%) by 22.8 percentage points.[1]
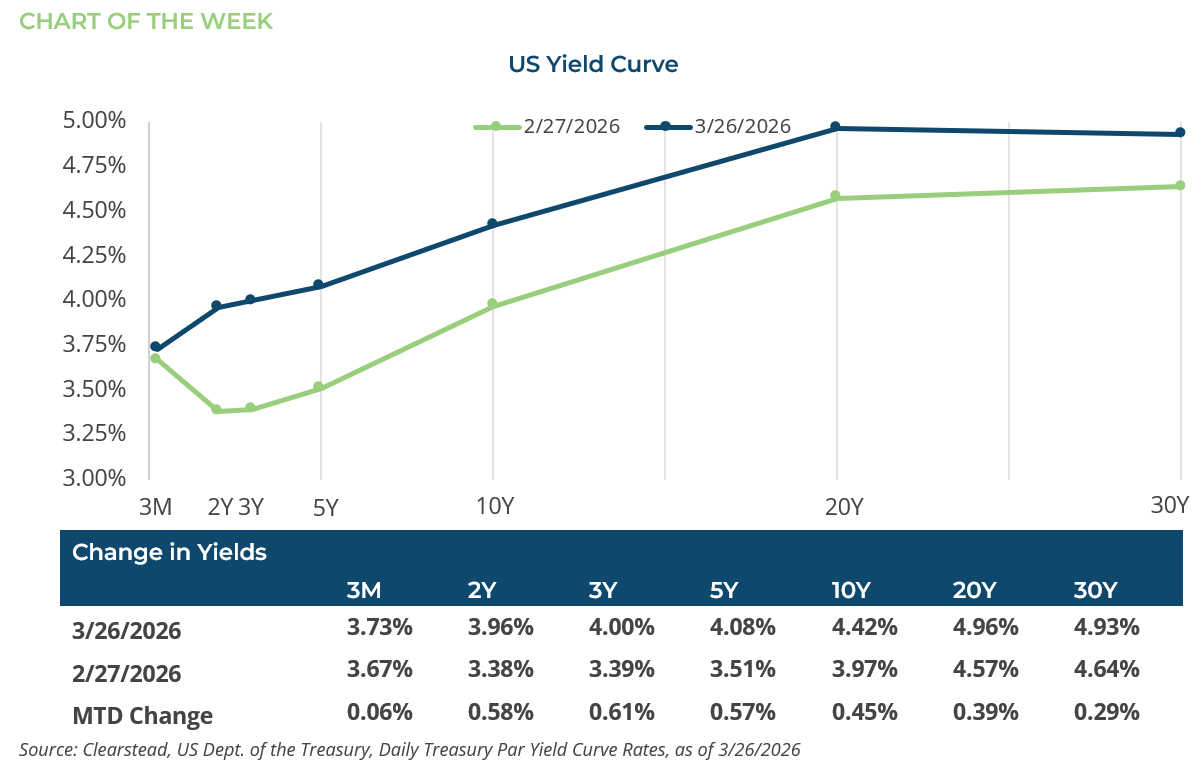
ONE MORE THOUGHT: The Story of the Yield Curve[1]
The yield curve this month can be told in three chapters. The first chapter notes that the yield on the U.S. Treasury (UST) 2-year note (3.96%) surpassed the effective Fed Funds rate (3.64%) for the first time since March of 2023. The 2-year yield is considered a leading indicator because it often moves ahead of Federal Reserve policy, reflecting market expectations for future interest rate changes. The Fed’s somewhat hawkish statement following its mid-March FOMC meeting was interpreted as a sign that the central bank has ended its easing policy. The 58-basis-point (bps) rise in the UST 2-year yield has led some forecasters to predict that the Fed’s next move could mark the start of a tightening cycle. In the second chapter, even amid a decline in equity markets and conflict between the US and Iran, the safe-haven appeal of UST bonds has not calmed fixed-income investors’ primary concern – persistent inflation. Sticky inflation above the Fed’s 2% inflation target, coupled with elevated energy prices, has weighed on sentiment. As a result, the UST 10-year yield rose 45 bps to 4.42%. The final chapter centers on persistent budget deficits that have prompted the US Treasury Department to issue record amounts of long-term debt. Interest costs on government debt are on track to become the largest expense in the federal budget. Interest outlays have already surpassed defense spending and are projected to surpass annual Medicare spending in 2028 and annual Social Security payments in 2047, becoming the single largest budget category.[2] The Center for Economic Policy Research notes, “Protecting taxpayers from large spending shocks may require shifting part of the burden onto bondholders through inflation or financial repression. Economic theory suggests that such policies may also reduce the safety of government debt and may raise borrowing costs over time if investors anticipate these risks.”[3] In this environment, long-term bonds are no longer a reliable buffer and have lost some of their appeal as a safe-haven investment; accordingly, the UST 30-year yield has climbed to nearly 5%.

[1] Bloomberg LP, 3/27/2026
[2] Peter G. Peterson Foundation, National Debt Projected to Hit 175% GDP; Interest Totals $99 Trillion
[3] https://cepr.org/voxeu/columns/safe-until-crisis-what-300-years-wars-reveal-about-government-debt-safety
Information provided in this article is general in nature, is provided for informational purposes only, and should not be construed as investment advice. These materials do not constitute an offer or recommendation to buy or sell securities. The views expressed by the author are based upon the data available at the time the article was written. Any such views are subject to change at any time based on market or other conditions. Clearstead disclaims any liability for any direct or incidental loss incurred by applying any of the information in this article. All investment decisions must be evaluated as to whether it is consistent with your investment objectives, risk tolerance, and financial situation. You should consult with an investment professional before making any investment decision. Performance data shown represents past performance. Past performance is not an indicator of future results. Current performance data may be lower or higher than the performance data presented. Performance data is represented by indices, which cannot be invested in directly.
Related or Tagged New Posts

market perspectives
March 23rd 2026
Research Corner | 3/23/2026
market perspectives
March 16th 2026
Research Corner | 3/16/2026
market perspectives
March 9th 2026
Research Corner | 3/9/2026

market perspectives
March 2nd 2026
Impact of Escalating Conflict in Iran
market perspectives
March 2nd 2026
Research Corner | 3/2/2026
market perspectives
February 23rd 2026
Research Corner | 2/23/2026
market perspectives
February 16th 2026
Research Corner | 2/16/2026

market perspectives
February 12th 2026
Market Update | US Dollar Debasement
market perspectives
February 9th 2026
Research Corner | 2/9/2026
market perspectives
February 2nd 2026
Research Corner | 2/2/2026
market perspectives
January 26th 2026
Research Corner | 1/26/2026
market perspectives
January 20th 2026
Research Corner | 1/20/2026