OBSERVATIONS
- Markets traded lower last week in the aftermath of the US-Israel attack on Iran. The S&P 500 lost 2.0% and small caps (Russell 2000) lost 4.0%, while the yield on the 10-Year Treasury rose after a volatile week of trading by 20 basis points to end the week at 4.14%.[1]
- The ISM Manufacturing PMI was little changed in February, registering 52.4—any number above 50 signals expanding economic activity—just below January’s 52.6, but better than consensus expectations.[1]
- Meanwhile, the ISM Services PMI increased in February to 56.1—well ahead of expectations—from January’s 53.8 figure and registered the highest reading since June-2022.[1]
- Initial unemployment claims remain very low, with only 213,000 new claims registered last week, which was unchanged from the week prior, and about 13k fewer than the same week last year.[1]
- Retail sales were soft but in line with expectations in January. The headline retail sales figure fell 0.2% month-over-month (MoM), while retail sales excluding autos and gas grew by 0.3% MoM.[1]
- The jobs report came in much weaker than expected and the unemployment rate increased to 4.4% in February from January’s 4.3% level. The report also showed that the economy lost 92k jobs in February, and January’s job growth was revised lower from 130k to 126k. December’s job numbers were also revised down substantially, from 48k jobs created to 17k jobs lost.[1]
EXPECTATIONS
- There are no Fed speakers next week as the Fed enters its quiet period ahead of its next meeting March 17-18. Markets widely expect the Fed to hold rates steady at the next meeting—Fed Funds Futures show about a 7% chance of a 25 basis point rate cut—but expect about a 57% chance of a rate cut by June.[1]
- China’s plenary sessions kicked off last week with Premier Qiang—President Xi’s effective deputy—announcing key economic targets and fiscal budget parameters for 2026. Chinese policymakers lowered their real GDP growth target to “4.5-5%” this year from “around 5%” last year. This marks the lowest growth goal since the early 1990s. Despite sluggish economic activity, a weak housing market, and poor business and household sentiment, the Chinese government did not announce any new fiscal stimulus.[2]
ONE MORE THOUGHT: US-Iran War – Could Markets Underestimate the Length?[3]
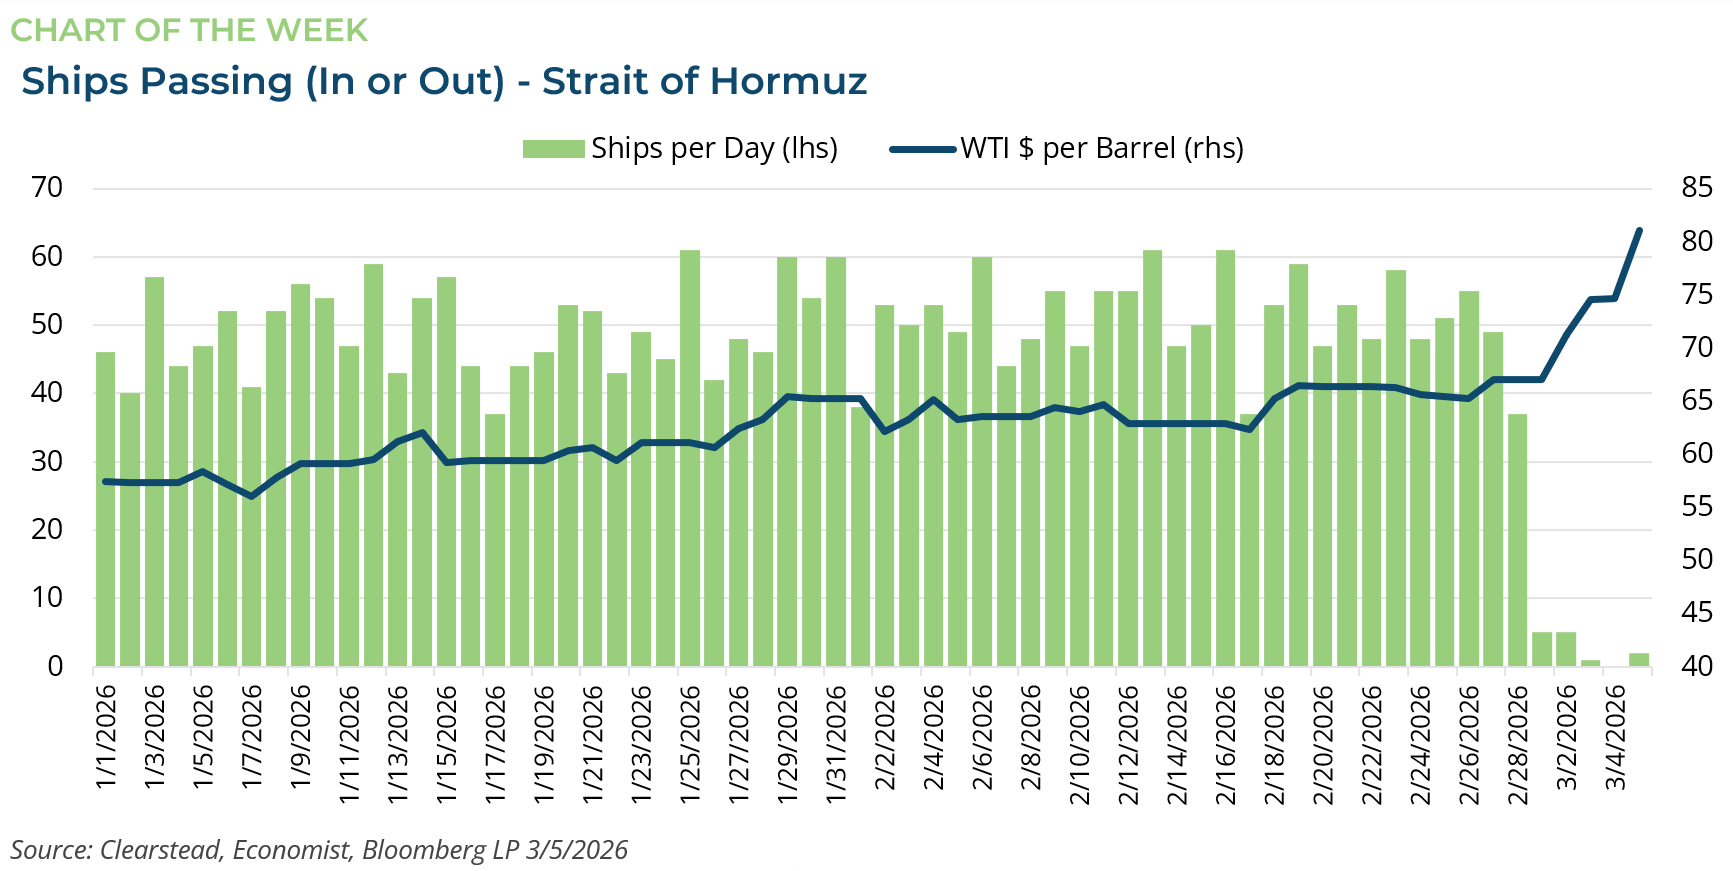
The US and Iran have been at war for just over a week (see Market Perspective 2-Mar) and global financial markets are grappling with short-run, medium-term, and lasting impact from the conflict. In the week that followed the start of the war, global equities sold off. The Russell 3000 (a broad US equity index) lost 2.2% last week, while the MSCI World ex US Index (a broad index of non-US developed market equities) lost 6.5%. Emerging market equities were hit the hardest with the MSCI EM Index down 6.7% last week. Perhaps unsurprisingly, the US dollar has rallied in this global risk-off environment. However, the conflict’s largest impact is likely to be on the global energy sector. About 20% of global oil and gas transits the Strait of Hormuz, which is a narrow corridor off the coast of Iran that is now largely closed to ships—see Chart of the Week. Shipping traffic ground to a halt after Iran announced that it would attack ships transiting the strait and fired upon several ships on 3-March. As a result, most private insurers have either pulled shipping firms’ insurance altogether for ships transiting the strait or prohibitively increased the price. The Trump administration has asked the Development Finance Corporation to step in as an insurer of last resort, but thus far the strait remains effectively closed. This has prompted oil prices to increase further with the price of West Texas Intermediate Crude (WTI) at about $90 per barrel. Equally, much of Asia and Europe depend upon natural gas exports from the Middle East that also transit the strait and natural gas prices have also increased substantially in recent days—Dutch Natural Gas TTF Futures rose from €30 per Mwh to over €50. The impact on the global economy may not be as pronounced so long as the US military is able to re-open the Strait of Hormuz either through neutralizing the Iranian ability to fire upon ships or through a broader de-escalation of the conflict within a few weeks. This is perhaps what the market is still hoping for as the baseline scenario. The conflict has widened to include most gulf states, but some speculative assets have held up reasonably well. For instance, Bitcoin made gains last week, and Goldman Sach’s US Cyclicals vs Defensive Index barely budged (-0.34%) through Thursday but declined on Friday by almost 2% suggesting that investors—at least in the US—have only just begun to change their outlook on risks and lean into defensive stocks. Should the conflict become protracted or if Iranian guerilla activities are able to keep up the pressure on global shipping in the strait even after most military operations have wound down, the economic fallout may prove to be more meaningful than what is priced into risk assets at present.

[1] Bloomberg LP, 3/6/2026
[2] Goldman Sachs “China: Two Sessions Comment 1: 2026 government policy targets largely as expected” 5-March-2026
[3] https://www.ft.com/content/6ddeb488-0d6f-4b6a-b419-2a2ba7437a25
Information provided in this article is general in nature, is provided for informational purposes only, and should not be construed as investment advice. These materials do not constitute an offer or recommendation to buy or sell securities. The views expressed by the author are based upon the data available at the time the article was written. Any such views are subject to change at any time based on market or other conditions. Clearstead disclaims any liability for any direct or incidental loss incurred by applying any of the information in this article. All investment decisions must be evaluated as to whether it is consistent with your investment objectives, risk tolerance, and financial situation. You should consult with an investment professional before making any investment decision. Performance data shown represents past performance. Past performance is not an indicator of future results. Current performance data may be lower or higher than the performance data presented. Performance data is represented by indices, which cannot be invested in directly.
Related or Tagged New Posts

market perspectives
March 30th 2026
Research Corner | 3/30/2026
market perspectives
March 23rd 2026
Research Corner | 3/23/2026
market perspectives
March 16th 2026
Research Corner | 3/16/2026

market perspectives
March 2nd 2026
Impact of Escalating Conflict in Iran
market perspectives
March 2nd 2026
Research Corner | 3/2/2026
market perspectives
February 23rd 2026
Research Corner | 2/23/2026
market perspectives
February 16th 2026
Research Corner | 2/16/2026

market perspectives
February 12th 2026
Market Update | US Dollar Debasement
market perspectives
February 9th 2026
Research Corner | 2/9/2026
market perspectives
February 2nd 2026
Research Corner | 2/2/2026
market perspectives
January 26th 2026
Research Corner | 1/26/2026
market perspectives
January 20th 2026
Research Corner | 1/20/2026