OBSERVATIONS
- Markets were whipsawed last week by the Trump Administration’s evolving tariff policy. The S&P began the week continuing its slide from earlier in the month, but jumped on Wednesday (see Expectations) by almost 10% after Trump announced a 90-day pause to most tariffs. The S&P ultimately traded higher last week, gaining 5.7%, while small caps (Russell 2000) gained 1.8% and the yield on the 10-year Treasury rose 49 basis points to end the week at 4.49%.[1]
- The VIX Index—the so called “Fear Gauge”—spiked on 3-April due to the reciprocal tariff announcement suggesting extreme fear and uncertainty in equity markets and has remained above 30 (panic levels) for most of last week. The VIX closed last Tuesday over 50, which was its highest close since 1-Apr-2020 in the days after most of the US economy was shuttered due to the onset of the Covid pandemic.[1]
- Headline and core inflation came in better than expected in March. Headline CPI registered 2.4% year-over-year (YoY) down from February’s 2.8% YoY figure, while core-CPI—which removes volatile food and energy prices—fell to 2.8% YoY down from February’s 3.1% YoY level.[1]
- Producer prices, which measure inflation at the wholesale level, fell in March to 2.7% YoY—lower than February’s 3.2% YoY level. Core-PPI, which excludes food and energy, also eased to 3.3% YoY in March.[1]
- Small business optimism declined further in March, falling to 97.4—just below the 51-year average of 98—as an increasing number of small businesses expressed uncertainty over coming business conditions.[1]
- Consumer sentiment fell for the fourth straight month, sliding to 50.8 in April, which is the lowest level since Jun-2022 when inflation was soaring. Consumer’s 1-year inflation expectations surged to 6.7% YoY—the highest level since 1981.[1]
EXPECTATIONS
- The minutes of the last Fed meeting in mid-March underscored the idea that most Fed members judged that “inflation was likely to be boosted this year by the effects of higher tariffs,” although significant uncertainty surrounded the magnitude and persistence of such effects.[1]
- Mid-day last Wednesday, the Trump administration announced that most reciprocal tariffs would be placed on a 90-pause allowing for bilateral negotiations regarding permanent tariff levels. The announcement set a minimum tariff level at 10%—autos, steel, aluminum (subject to some exclusions) are still set at 25%—and tariffs on Chinese goods were actually increased to 145% by the end of the week as China vowed to retaliate with 125% counter-tariffs of its own on US exports to China.[1]
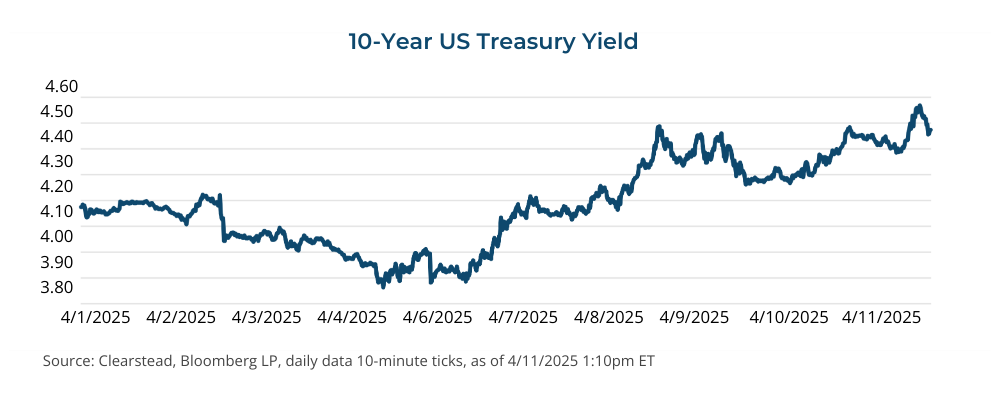
ONE MORE THOUGHT: Bond market volatility helps spark tariff reprieve[1]
During times of financial market stress, it is easy to get caught up in the chaos and make decisions, sometimes successful (lucky?) or futile, in an attempt to get ahead of the market. These decisions may have a historical precedent at the core of the analysis, but often they get amplified by market rumors or simply following the thundering herd. This past week’s bond market was a case study in market activity operating in a rapidly changing environment in an information vacuum replaced with countless rumors and prognosticators filling the void. Since peaking in mid-February, the S&P 500 has been gradually declining and as financial market theory would suggest, interest rates should decline as investors seek to reduce their risk exposure and move to bonds, driving down yields. But what was a gradual equity market decline turned into a rout on April 2, a date President Trump proclaimed, “Liberation Day”, the administration announced the most sweeping tariff hike since the Smoot-Hawley Tariff Act of 1930. What ensued has been a dramatic decline in equities and a surprising rise in U.S. interest rates. While interest rates initially declined (10-year yield went from 4.20% on April 2nd to a low of 3.86% on Friday, April 4th) as the stock market cratered, yields then proceeded to rise as the stock market’s woes persisted. What initially sounded plausible for the rise in yields was that a complicated strategy employed by hedge funds (the Basis Trade) had not worked, which would cause hedge funds to dump their Treasury bonds to cover their short positions and meet margin calls. Then news that a $58 billion auction of 3-year Treasury notes was met with weak demand had investors fear that foreign investors (i.e. Japan and China) were selling Treasuries in retaliation of the Trump tariffs. The fear was mounting, and investors ran for cover by selling even more Treasury securities and driving 10-year yields to 4.50% by Wednesday morning, April 9th. Of course, all of this is rumor and/or conjecture because, to date, there is no evidence to support any of these reasons for the rise in yields. On the news of a successful 10-year Treasury bond auction and the 90-day tariff cease fire, yields have since stabilized near 4.5%. In this uncertain reality we are living in, it is difficult to confidently invest to capture gains on fast moving market gyrations. Will the Fed lower the Fed Funds rate? Will foreign investors sell their Treasury bonds? Are we at the peak in yields? We don’t know with certainty the answer to these questions and the smart move is to put our emotions behind us and focus on what we know for sure and to make well-reasoned investment decisions.
CHART OF THE WEEK
[1] Bloomberg LP, as of 4/11/2025
DISCLOSURES: Information provided in this article is general in nature, is provided for informational purposes only, and should not be construed as investment advice. These materials do not constitute an offer or recommendation to buy or sell securities. The views expressed by the author are based upon the data available at the time the article was written. Any such views are subject to change at any time based on market or other conditions. Clearstead disclaims any liability for any direct or incidental loss incurred by applying any of the information in this article. All investment decisions must be evaluated as to whether it is consistent with your investment objectives, risk tolerance, and financial situation. You should consult with an investment professional before making any investment decision. Performance data shown represents past performance. Past performance is not an indicator of future results. Current performance data may be lower or higher than the performance data presented. Performance data is represented by indices, which cannot be invested in directly.
Related or Tagged New Posts

market perspectives
March 16th 2026
Research Corner | 3/16/2026
market perspectives
March 9th 2026
Research Corner | 3/9/2026

market perspectives
March 2nd 2026
Impact of Escalating Conflict in Iran
market perspectives
March 2nd 2026
Research Corner | 3/2/2026
market perspectives
February 23rd 2026
Research Corner | 2/23/2026
market perspectives
February 16th 2026
Research Corner | 2/16/2026

market perspectives
February 12th 2026
Market Update | US Dollar Debasement
market perspectives
February 9th 2026
Research Corner | 2/9/2026
market perspectives
February 2nd 2026
Research Corner | 2/2/2026
market perspectives
January 26th 2026
Research Corner | 1/26/2026
market perspectives
January 20th 2026
Research Corner | 1/20/2026

market perspectives
January 12th 2026
Quarterly Market Insights | 4Q25