OBSERVATIONS
- Markets traded sharply lower after Trump’s reciprocal tariff announcements (see One More Thought) with the S&P 500 losing -9.1% and small caps (Russell 2000) down -9.6%, while the yield on the 10-year Treasury fell -25 basis points to end the week at 4.0%.[1]
- The ISM Manufacturing PMI declined to 49.0 in March from February’s 50.3 figure—any reading below 50 indicated contracting activity—while the prices paid sub-index jumped to 69.4, which is the highest level since June-2022 and suggests many factories are facing rising input costs as Trump’s tariffs begin to bite.[1]
- The ISM Services PMI also weakened in March, falling to 50.8 from February’s 53.5 figure. Additionally, both the prices paid sub-index and the new order sub-index also softened in March.[1]
- The Jobs and Labor Turnover Survey (JOLTS) showed that job openings modestly declined in February (most recent data) to 7.568 million openings—down -2.5% month-over-month. However, the quit rate, a measure of worker confidence in finding a new job, remained at 2.0% (about 3.2 million monthly quits).[1]
- Unemployment claims showed no signs of weakness as initial claims fell -6k last week to 219k new claims, suggesting at least the labor market remains healthy.[1]
- In March, the US economy created +228k new jobs, which was well ahead of expectations. The unemployment rate did tick up to 4.2% in March from February’s 4.1% level, but labor force participation increased to 62.4% as the resilient labor market drew in more job seekers.[1]
EXPECTATIONS
Last week, Fed speakers generally emphasized the resiliency of the labor market and, thus far, the stability in consumer spending. While several Fed speakers acknowledged that sentiment indicators for both businesses and households had noticeably weakened, they did not yet see clear signs of spending pullback and they reiterated their caution as the impact of the new tariff policies work through the economy.[1]
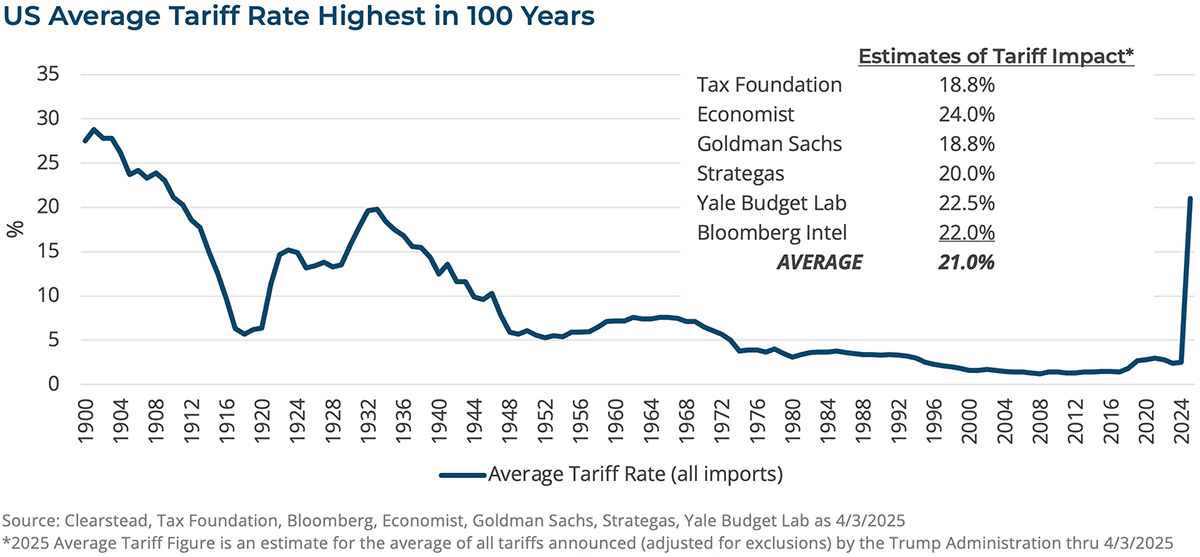
ONE MORE THOUGHT: Liberation Day and Trump Tariffs[1]
While markets had been given ample forewarning of “Liberation Day” whereby Trump would announce reciprocal tariffs on most countries trading with the US, the magnitude of the tariffs announced went beyond what the markets had anticipated and thus last week’s sell-off. The sweeping tariffs take the average effective rate for all US imports to over 20%, which the US has not experienced since the early years of the 1900s—see Chart of the Week. Most of the countries tariffed by the US have pledged to retaliate in some fashion and it is safe to conclude a global trade war with the US has begun. China, for instance, countered last Friday with a 34% tariff on US imports. While the Trump Administration may be willing to negotiate on the margin, markets and global supply chains are likely going to have to adjust to a structurally higher average tariff rate. Equity markets reacted negatively to these announcements and markets sold off sharply in Asia and Europe, the US, and Latin America—from Thursday 3-Apr to Friday 4-Apr, the S&P 500 -10.5%, MSCI Europe -6.5, MSCI Asia -2.9% and MSCI LatAM -5.6%. The imposition of these tariffs along with those the Trump Administration has already announced (see RC 17-Feb) is likely to slow US and global growth for the remainder of 2025. In many cases corporate profits will come under pressure as input prices rise, export markets become harder to sell into, and the US consumer pulls back in the face of a possible one time upward movement in the prices for many goods. Goldman Sachs estimates that for every 5 percentage-point increase in tariffs, corporate earnings for the S&P 500 are reduced by about 1-2 percentage-points.[2] One model of GDP growth (Atlanta Fed GDPNowcast) is suggesting growth for Q1 is likely to be close to zero and estimates range from -0.5% to -1.0% negative effect in terms of these tariff policies’ impact on US growth for the full year. It is worth noting that, should these tariff levels remain in place, they could bring in as much as $700 billion per year, according to an initial estimate by Capital Economics—but this assumes that US consumption patterns are largely unchanged after the tariffs are implemented. Nonetheless, tariff revenue could make it easier for passing a new fiscal package—tax and spending cuts along with debt ceiling adjustments—which may eventually help shift the market sentiment towards better days. It is still feasible to conclude deregulation along with tax and spending reform could begin to balance out the growth headwinds manifested in these tariffs with more market friendly measures. While the risks of recession are heightened in the aftermath of these tariff announcements—it is still not our baseline outlook—and it is worth noting that the US economy comes into this trade war in good shape—low unemployment, strong corporate balance sheets, and an economy more levered to domestic consumption than global trade. In the meantime, it is reasonable to expect equity markets to experience continued consolidation within a generally sideways market likely in the coming quarter along with higher than usual volatility.

[1] Bloomberg, LP 4/4/2025
[2] Goldman Sachs US Weekly Kickstart “Among the key policy shifts in April, tariffs will outweigh the slowing of QT for equities” 3/28/2025
DISCLOSURES: Information provided in this article is general in nature, is provided for informational purposes only, and should not be construed as investment advice. These materials do not constitute an offer or recommendation to buy or sell securities. The views expressed by the author are based upon the data available at the time the article was written. Any such views are subject to change at any time based on market or other conditions. Clearstead disclaims any liability for any direct or incidental loss incurred by applying any of the information in this article. All investment decisions must be evaluated as to whether it is consistent with your investment objectives, risk tolerance, and financial situation. You should consult with an investment professional before making any investment decision. Performance data shown represents past performance. Past performance is not an indicator of future results. Current performance data may be lower or higher than the performance data presented. Performance data is represented by indices, which cannot be invested in directly.
Related or Tagged New Posts

market perspectives
March 16th 2026
Research Corner | 3/16/2026
market perspectives
March 9th 2026
Research Corner | 3/9/2026

market perspectives
March 2nd 2026
Impact of Escalating Conflict in Iran
market perspectives
March 2nd 2026
Research Corner | 3/2/2026
market perspectives
February 23rd 2026
Research Corner | 2/23/2026
market perspectives
February 16th 2026
Research Corner | 2/16/2026

market perspectives
February 12th 2026
Market Update | US Dollar Debasement
market perspectives
February 9th 2026
Research Corner | 2/9/2026
market perspectives
February 2nd 2026
Research Corner | 2/2/2026
market perspectives
January 26th 2026
Research Corner | 1/26/2026
market perspectives
January 20th 2026
Research Corner | 1/20/2026

market perspectives
January 12th 2026
Quarterly Market Insights | 4Q25