OBSERVATIONS
- The S&P 500 hit a record high last Friday and gained 3.5% for the week, while small caps (Russell 2000) gained 3.0%, and the yield on the 10-year Treasury fell 10 basis points to end the week at 4.28%.[1]
- Housing prices increased 2.7% year-over-year (YoY) in May, down from a 3.4% YoY gain in the previous month continuing the housing market’s gradual deceleration in prices that began in early 2024.[1]
- Existing home sales increased to 4.03 million (annualized rate) in May, which was a 0.8% increase month-over-month (MoM) but through the first five months of the year existing home sales were about 0.8% lower compared to the first five months of 2024.[1]
- New home sales declined to 623k (annualized rate) in May, which is 23.7% below the new home sales rate in April and 6.3% below the rate in May-2024.[1]
- Durable goods orders increased 16.4% MoM in May, but excluding transportation (autos and aircraft) durable goods orders increased 0.5% MoM which was better than expected—consensus was 0% MoM.[1]
- Initial unemployment claims remain low and declined to 236k new claims last week, a decline of 9k claims from the week prior, and continue to be on par with the claim number for the same week last year.[1]
- The Fed’s preferred gauge of inflation, core-PCE Index which removes volatile food and energy prices, showed that inflation increased to 2.7% YoY in May, which was higher than April’s 2.5% YoY figure.[1]
EXPECTATIONS
- The final estimate for real GDP growth in Q1 was -0.5% (annualized rate), however this number was largely driven by a large increase in imports in February and March as companies tried to bolster supplies ahead of the Trump administration’s April reciprocal tariff policy. Currently, the Atlanta Fed’s GDPNow model indicates that economic growth is tracking towards 3.0% (annualized rate) in Q2. Averaging the two figures suggests the economy grew by about 1.2% in the first half of the year.[1]
- Oil (WTI Crude) prices moved from about $60 per barrel at the start of June to almost $80 on the eve of the US attack on Iran’s nuclear facilities, but has since fallen to about $65 as Iran and Israel have largely abided by a ceasefire brokered by US diplomats after the US bombing of key nuclear sites (see RC 23-June). This strongly suggests that markets anticipate this nascent ceasefire to stick, and Iran is unlikely to disrupt oil markets by closing the Strait of Hormuz.[1]
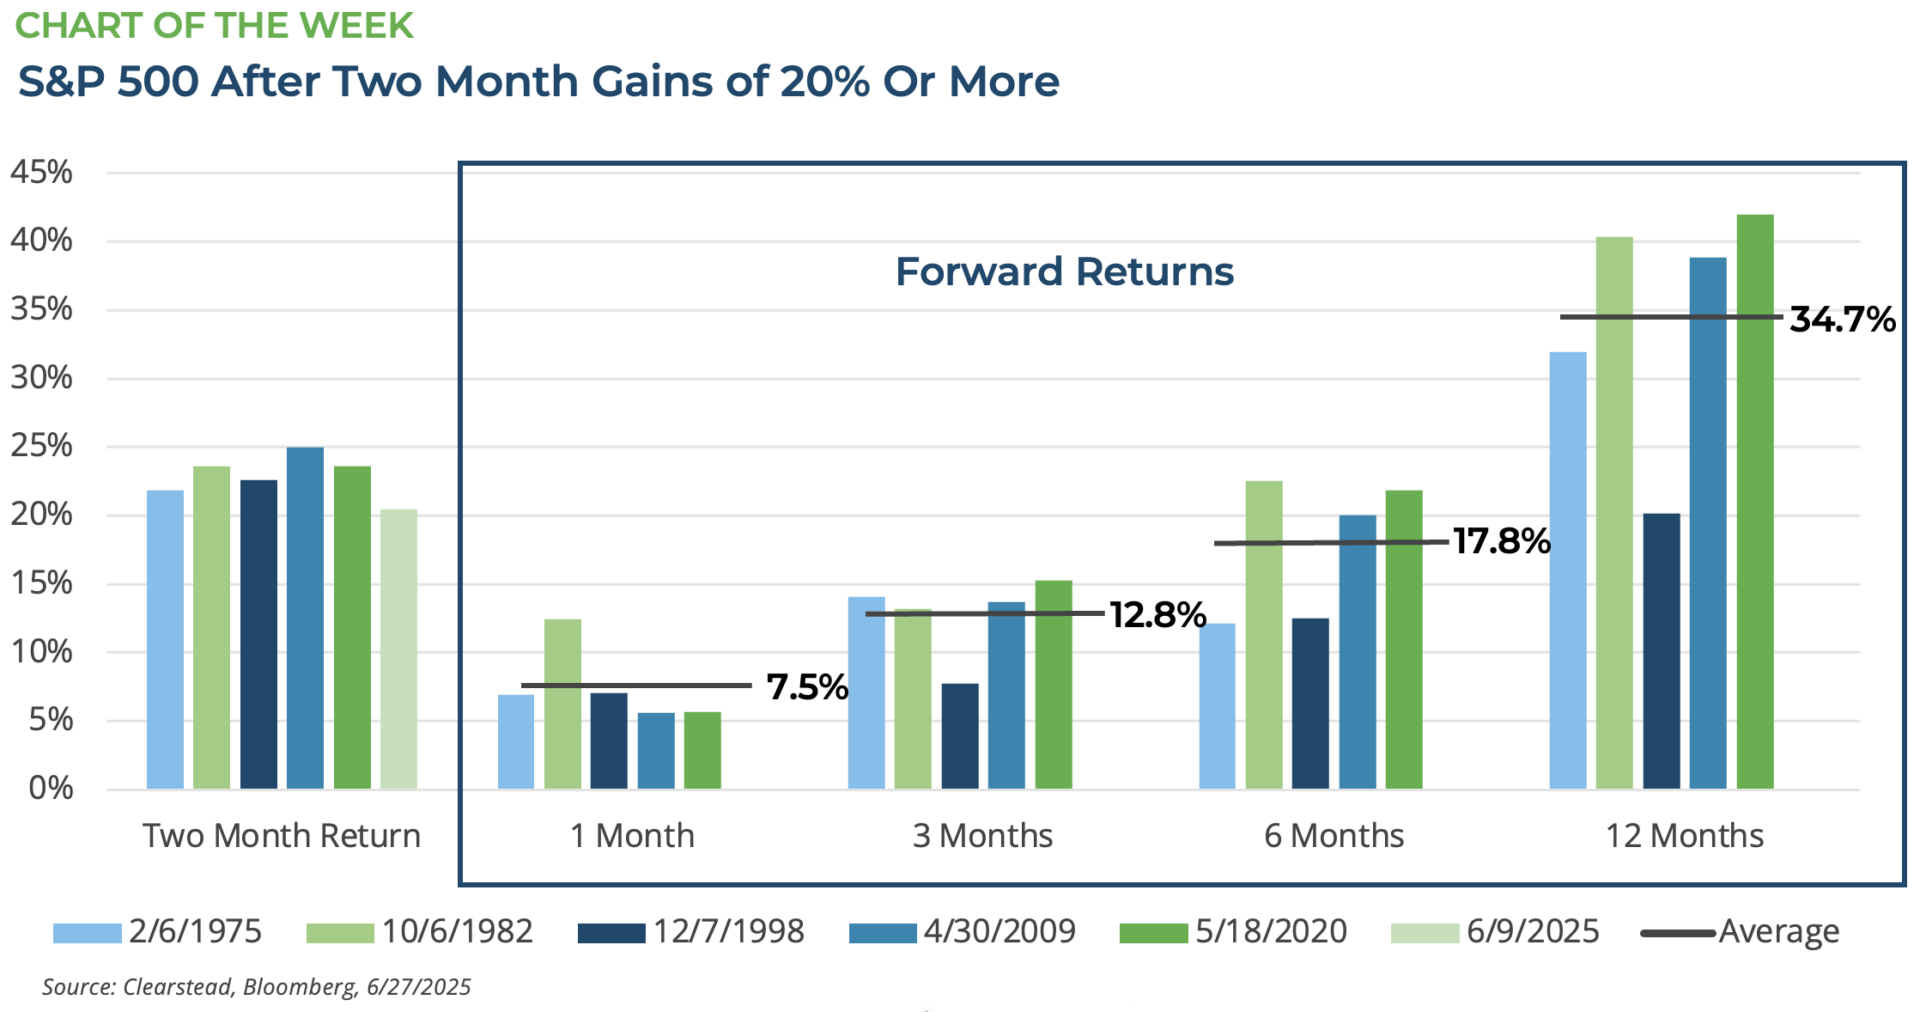
ONE MORE THOUGHT: S&P 500 Finishing June Near Record Highs[1]
With one trading day to go in June, the S&P 500 once again is trading at record highs. The S&P 500 had a record high close on February 19, 2025, but concerns around the AI-trade, US tariff policy, and a host of geopolitical risks saw the S&P 500 lose more than 19% over the next seven weeks. The S&P 500 bottomed early on the morning of April 9th, but then the Trump administration paused a large portion of their reciprocal tariff policy. In the coming weeks, Q1 earnings surprised to the upside with over 13% YoY earnings growth, economic data continued to show a resilient US economy, and investor sentiment swung from negative to positive. The result was a strong snap-back and by early June the S&P 500 had gained over 20% in just two months. This has only happened five times in the previous 60 years—a 20% gain in the S&P 500 in only two months—and each time the subsequent 1-month, 3-month, 6-month, and 12-month periods have registered positive returns (see Chart of the Week). June, itself, was not without catalysts for equity market volatility, such as the 12-Day War between Iran and Israel (including a surprise US attack on select targets in Iran) or the back-and-forth over the new US tax and spending bill winding its way through Congress, but nonetheless the S&P 500 made steady gains during the month—nearly 65% of trading days registered gains in June. This is not to say that equity markets are in a goldilocks environment. There remains uncertainty as to the impact of the US tariff policy—will Trump increase tariffs in July absent direct bilateral deals or will the current tariff policy (current state) weaken growth, curb corporate profits or spur inflation. The recent rally in the S&P 500 has, once again, been powered by a narrow group of AI-sector stocks (particularly the Mag 7: Alphabet, Amazon, Apple, Meta Platforms, Microsoft, Nvidia, and Tesla) and the valuation for the S&P 500 is very high relative to long-run index history. Therefore, as we head into Q3, equity markets have a fair bit of positive momentum behind them, but they are also priced for a very positive environment in H2-2025. An unforeseen setback to AI-stock earnings, another adverse pivot on US tariffs, the failure of Congress to pass a budget bill, or the re-emergence of a major geopolitical shock (Ukraine, Middle East, South China Sea) could reset investor expectations, and we could see equity market volatility re-assert itself in the weeks and months ahead.

[1] Bloomberg LP, 6/27/2025
Information provided in this article is general in nature, is provided for informational purposes only, and should not be construed as investment advice. These materials do not constitute an offer or recommendation to buy or sell securities. The views expressed by the author are based upon the data available at the time the article was written. Any such views are subject to change at any time based on market or other conditions. Clearstead disclaims any liability for any direct or incidental loss incurred by applying any of the information in this article. All investment decisions must be evaluated as to whether it is consistent with your investment objectives, risk tolerance, and financial situation. You should consult with an investment professional before making any investment decision. Performance data shown represents past performance. Past performance is not an indicator of future results. Current performance data may be lower or higher than the performance data presented. Performance data is represented by indices, which cannot be invested in directly.
Related or Tagged New Posts

market perspectives
March 16th 2026
Research Corner | 3/16/2026
market perspectives
March 9th 2026
Research Corner | 3/9/2026

market perspectives
March 2nd 2026
Impact of Escalating Conflict in Iran
market perspectives
March 2nd 2026
Research Corner | 3/2/2026
market perspectives
February 23rd 2026
Research Corner | 2/23/2026
market perspectives
February 16th 2026
Research Corner | 2/16/2026

market perspectives
February 12th 2026
Market Update | US Dollar Debasement
market perspectives
February 9th 2026
Research Corner | 2/9/2026
market perspectives
February 2nd 2026
Research Corner | 2/2/2026
market perspectives
January 26th 2026
Research Corner | 1/26/2026
market perspectives
January 20th 2026
Research Corner | 1/20/2026

market perspectives
January 12th 2026
Quarterly Market Insights | 4Q25