Research Corner | 6/9/2025

OBSERVATIONS
- Markets traded higher last week with the S&P 500 gaining 1.5% to reach the 6,000 level for the first time since late February. Small cap stocks (Russell 2000 Index) gained 3.2%, while the yield on the 10-year Treasury rose 11 basis points to end the week at 4.51%.[1]
- The Manufacturing sector PMI for May came in below expectations and declined to 48.5, down from April’s 48.7 level—any figure below 50 denotes contracting activity.[1]
- The Services sector PMI also disappointed in May, falling to 49.9 down from April’s 51.6 level. The new orders subcomponent dropped to 46.4 in May from April’s 52.3, while the prices-paid subcomponent—a measure of input prices in the services sector—surged to the highest level since Nov-2022.[1]
- The Jobs and Labor Turnover Survey (JOLTS) showed 7.391 million open jobs in April (latest data available), which was 190k more job openings than in March. However, the quit rate—an indicator of how confident workers feel in finding a new job—fell to 3.2 million in April down from March’s 3.3 million quits.[1]
- Jobless claims for the most recent week registered 247k, above expectations of 235k and lifting the 4-week moving average to 235k (the highest level since October ’24).[1]
- The US economy added 139k jobs in May versus expectations of 126k and the unemployment rate held steady at 4.2%. May’s job gains, if they hold, will be the 2nd best monthly employment gain year-to-date — the previous two months were revised lower by a combined 95k jobs.[1]
EXPECTATIONS
- The European Central Bank (ECB) cut its main policy rate by 25 basis points to 2.0% as the ECB expects Euro area inflation to stabilize near the bank’s 2.0% target. However, ECB President Christine Lagarde also noted that the inflation outlook was “more uncertain than usual” with risks to growth “tilted to the downside.”[1]
- The trade deficit narrowed in April, as compared to March, by a record 56% to $62 billion. The narrowing comes as imports fell and exports rose, likely ending the front-loaded importing from three months prior, ahead of tariff increases. The trade gap narrowing is likely to advance GDP growth, which at present is projected to be 3.8% for Q2 according to the Atlanta Fed’s GDPNow estimate.[1]
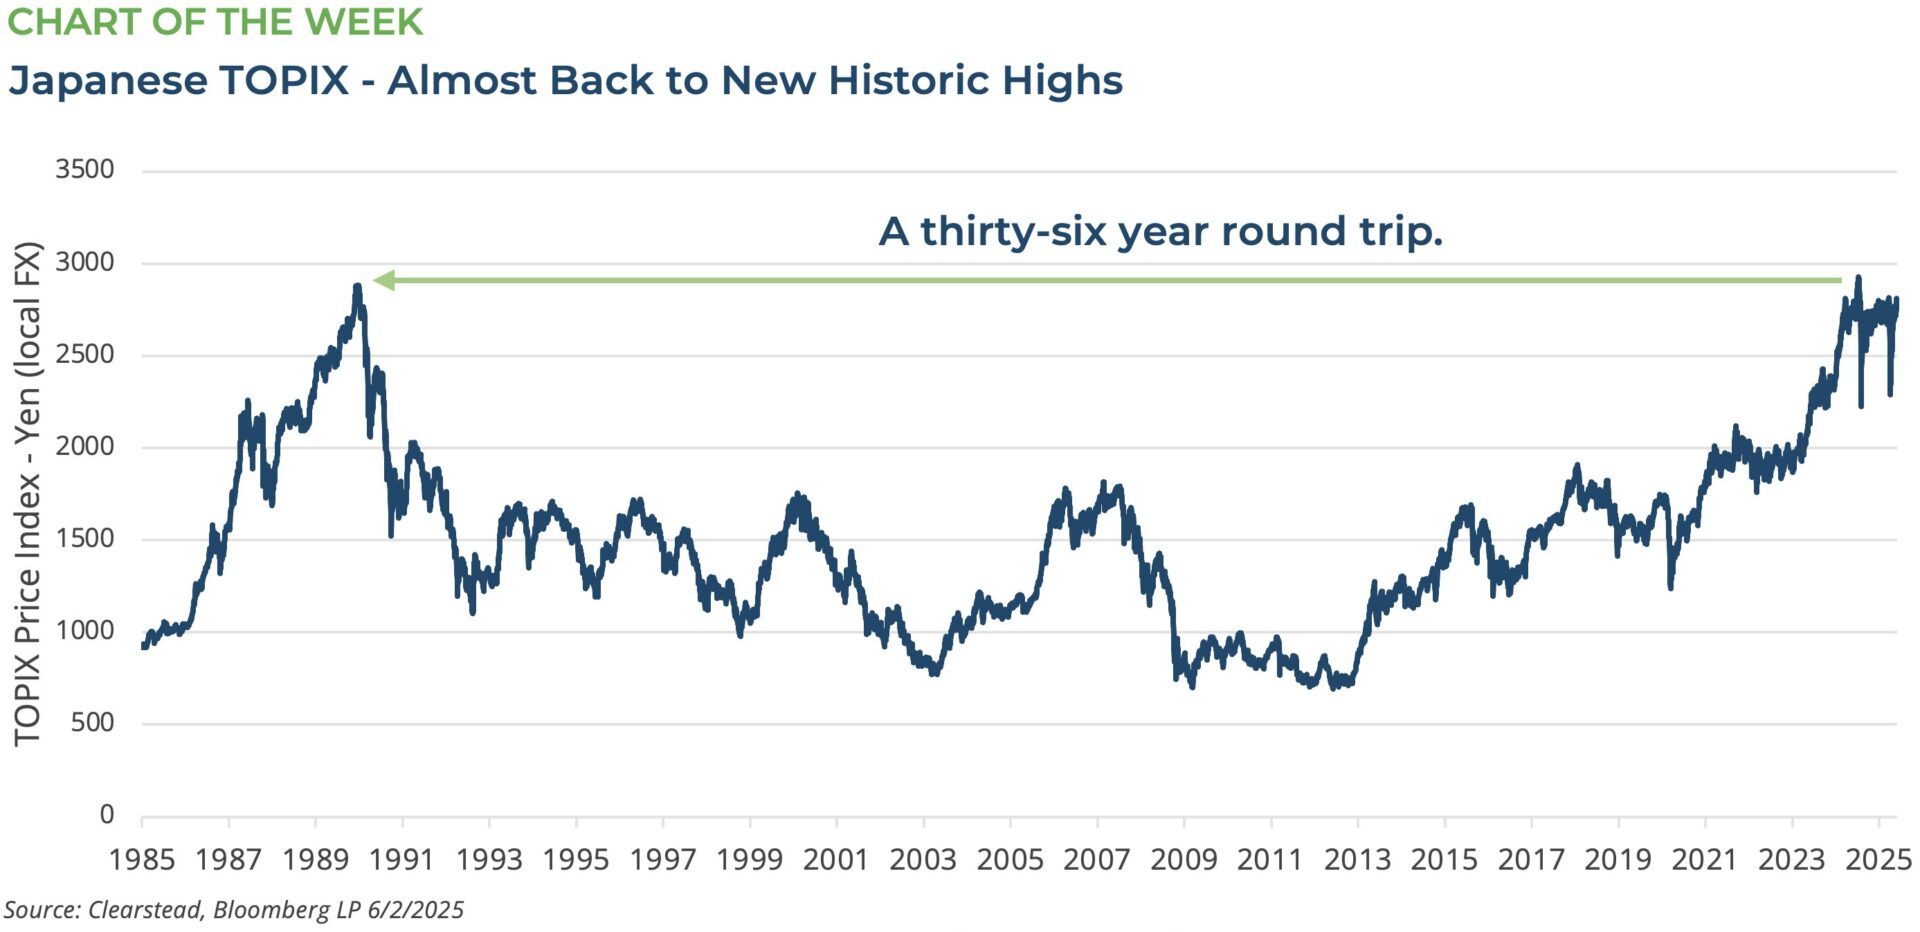
ONE MORE THOUGHT: Japanese Stock Index Quietly Retesting Historic Highs.[1]
In the late 1980’s the Japanese economy was the envy of the world. Japanese manufacturers were at the leading edge of efficiency and innovation. Japanese auto and electronics manufacturers had been steadily gaining share for years and despite opaque corporate ownership structures, Japanese conglomerates were standing at the commanding heights of the nascent global economy. However, this largely export-oriented competitiveness gave way to overleverage in many sectors, the Japanese Yen appreciated and made its exports less competitive, and a bubble in Japanese real estate markets emerged. In mid-Dec 1989, the Japanese stock market (TOPIX Index – a broad market cap weighted index covering all publicly traded Japanese stocks) hit 2,881 an historic high. However, as Japan’s real estate market began to cool, and the US slipped into a recession in mid-1990, the Bank of Japan raised interest rates to blunt inflation—in part caused by a surge in oil prices because of the first Gulf War— and the air came out of the Japanese equity market. The bursting of the Japanese asset bubble caused the TOPIX to decline over -60% from its record high to its lows in the late summer of 1992—see Chart of the Week. Unfortunately, as the 1990s unfolded, the Japanese economy and many Japanese firms were slow to adapt to the new internet-based technologies and the emerging threat to Japan’s manufacturing-oriented economy coming from China. Japanese firms, with their complex and interwoven corporate governance structures did not provide incentives for Japanese corporate leaders to make quick or substantial changes to strategy and business plans. The result was a multi-decade slide in Japanese equities culminating in a nearly 30-year low in 2012—over -75% decline from the 1989 peak—in the aftermath of the Global Financial Crisis. However, since then, the Japanese government has worked to improve the corporate governance structures of its largest firms and make them more shareholder friendly. Additionally, many Japanese firms have adapted to both the rise of China’s manufacturing base and its need for high-tech automation and efficiency improving technologies. As a result, the TOPIX has made steady gains over the past decade and for about two weeks in July-2024, the TOPIX hit a new record high and traded above 2,881 for the first time since Dec-1989. The US election of a second Trump administration and its evolving tariff policy have weighed on Japanese equities, but at the end of May, the TOPIX was once again within a few percentage points of its mid-2024 all-time high. As global supply chains re-orient in the wake of the US’s new tariff policies, Japanese equities seemed better positioned to take advantage of the evolving global landscape than they were in mid-1990s when globalization changed the economic map. Only time will tell if the TOPIX will chart a new historic high in 2025, but it is conceivable. Perhaps more importantly, another lost generation for Japanese equities looks unlikely.

[1] Bloomberg LP, 6/6/2025
Information provided in this article is general in nature, is provided for informational purposes only, and should not be construed as investment advice. These materials do not constitute an offer or recommendation to buy or sell securities. The views expressed by the author are based upon the data available at the time the article was written. Any such views are subject to change at any time based on market or other conditions. Clearstead disclaims any liability for any direct or incidental loss incurred by applying any of the information in this article. All investment decisions must be evaluated as to whether it is consistent with your investment objectives, risk tolerance, and financial situation. You should consult with an investment professional before making any investment decision. Performance data shown represents past performance. Past performance is not an indicator of future results. Current performance data may be lower or higher than the performance data presented. Performance data is represented by indices, which cannot be invested in directly.
Related or Tagged New Posts
market perspectives
March 30th 2026
Research Corner | 3/30/2026
market perspectives
March 23rd 2026
Research Corner | 3/23/2026
market perspectives
March 16th 2026
Research Corner | 3/16/2026
market perspectives
March 9th 2026
Research Corner | 3/9/2026

market perspectives
March 2nd 2026
Impact of Escalating Conflict in Iran
market perspectives
March 2nd 2026
Research Corner | 3/2/2026
market perspectives
February 23rd 2026
Research Corner | 2/23/2026
market perspectives
February 16th 2026
Research Corner | 2/16/2026

market perspectives
February 12th 2026
Market Update | US Dollar Debasement
market perspectives
February 9th 2026
Research Corner | 2/9/2026
market perspectives
February 2nd 2026
Research Corner | 2/2/2026
market perspectives
January 26th 2026
Research Corner | 1/26/2026