OBSERVATIONS
- Markets traded flat last week with the S&P gaining 0.6% and small caps (Russell 2000) gaining 0.2%, while the yield on the 10-year Treasury inched up 1 basis point to end the week at 4.42%.[1]
- Headline inflation (CPI) came in a bit higher than expected in June, with CPI increasing to 2.7% year-over-year (YoY), which was well above May’s 2.4% YoY rate. Meanwhile, core-CPI, which removes volatile food and energy prices, rose to 2.9% YoY, which was just above May’s core-CPI rate of 2.8% YoY. The goods sub-component for both headline and core-CPI showed an inflationary impact from April’s tariffs including furniture, clothes, shoes, toys, and appliances—all showing a sizable month-over-month (MoM) upward moves in prices.[1]
- In contrast, prices at the wholesale level (PPI Index) came in better than expected in June with headline PPI falling to 2.3% YoY down from May’s 2.7% YoY rate and core-PPI, which removes food and energy, fell to 2.6% YoY from May’s 3.2% YoY rate—both PPI and core-PPI came in below expectations. As with the CPI numbers, there was some tariff impact on goods inflation with the PPI numbers in June.[1]
- Industrial production improved in June increasing 0.3% MoM—expectations were for only 0.1% MoM increase—while capacity utilization moved higher to 77.6% in June and May’s industrial production numbers were revised higher.[1]
- Retail sales in June increased by 0.6% MoM, but May’s retail sales figure was revised lower. Total retail sales spending for Q2-2025, however, was 4.1% YoY higher (no inflation adjustment) than Q2-2024.[1]
- Initial unemployment claims remain low falling to 221k new claims—7k fewer claims than the week prior.[1]
- Housing starts improved in June to 1.321 million (annualized rate) from May’s 1.263 million rate, but for the first six months of 2025 new housing starts are down 1% compared to the first six months of 2024.[1]
- The University of Michigan consumer sentiment index inched up in July 61.8 from June’s 60.7, but remains well below its nearly 50-year average of 85.[1]
EXPECTATIONS
- Q2 earnings seasons got off to a good start with the largest banks largely beating expectations citing strong trading activity, an increase in investment banking activity, and a resilient US consumer. Goldman Sachs JPMorgan, Wells Fargo, Citigroup, and BlackRock all beat expectations for Q2 earnings growth.[1]
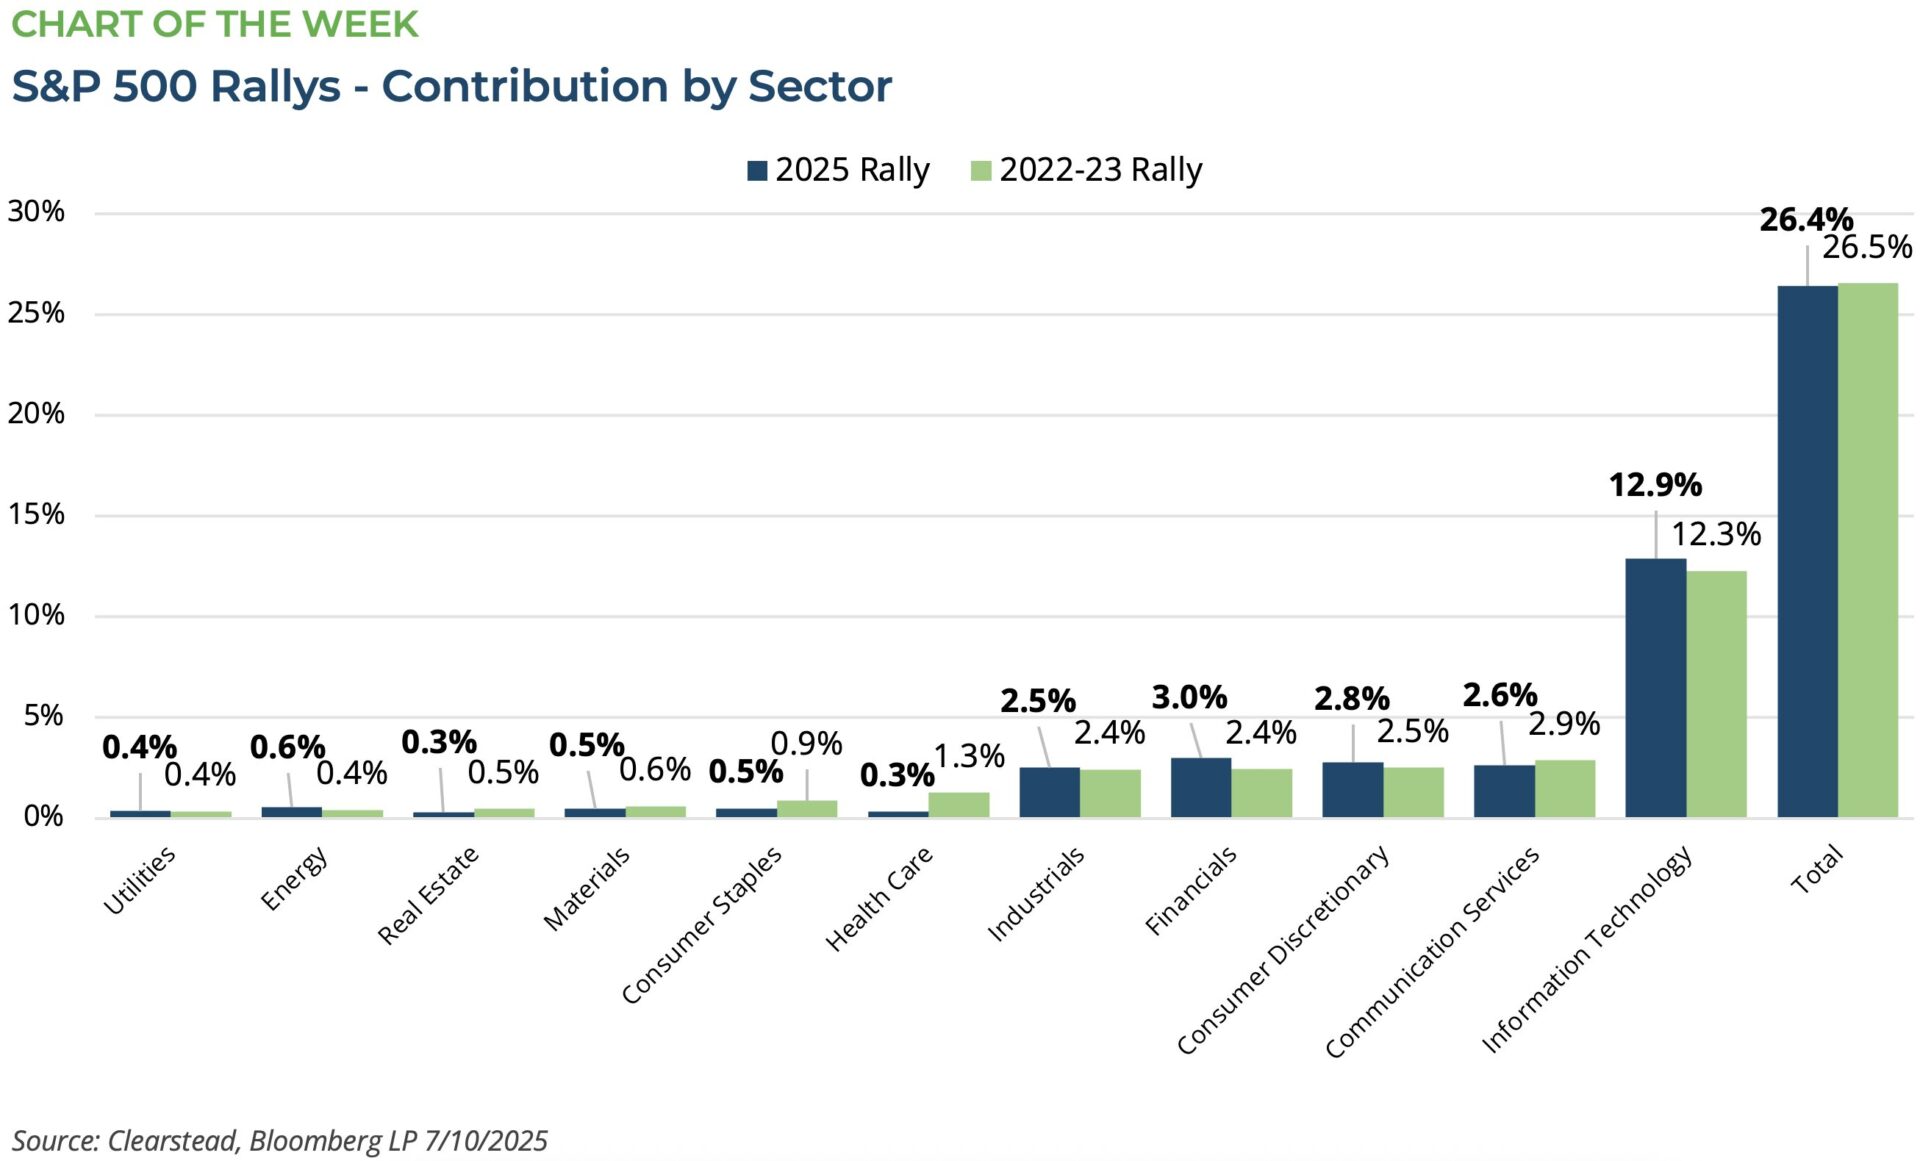
ONE MORE THOUGHT: Parallels Between the 2022-23 Rally and the 2025 Rally[1]
On Thursday, July 10th the S&P 500 hit its eighth record high of 2025 and capped off a 26% rally since its year-to-date low in early April. While the speed of this rally was impressive, its overall characteristics are very similar to the rally that took place in the period between Oct-2022 and Jul-2023. Over the course of about nine months, the S&P 500 rallied a similar amount—see Chart of the Week—and in similar fashion it was a rally powered by a narrow group of tech stocks. The first nine-months of 2022 were tough on equities as the Fed was rapidly increasing interest rates to combat a surge in inflationary pressure gripping the US economy. As the S&P 500 entered Q4-2022, markets had sold off for three straight quarters and big tech firms were right-sizing their workforces in the aftermath a Covid-pandemic hiring splurge. As a result, as markets headed into 2023, inflationary pressures began to recede, fears that the Fed would hike the US economy into a recession began to fade, and tech profits margins, in particular, improved. It was in this context that the S&P 500’s nine-month long rally from Oct-2022 to Jul-2023, was powered by a small number of tech stocks—the newly coined Magnificent 7 (Alphabet, Amazon, Apple, Meta, Microsoft, NVIDIA, and Tesla)—which accounted for about half the rally. Fast-forward to 2025, and once again a small number of tech stocks are leading the rally. When the S&P 500 hit its most recent historic high in early July, the median stock was still nearly 11% below its 52-week high. The experience of the 2022-23 rally suggests that the narrow leadership of the mega-cap tech stocks can persist for some time. By the end of 2023, S&P 500 had gained more than 26% for the year and the top 10 names in the index had contributed over 80% of the total gains. History suggests that we are more likely to eventually see the rest of the S&P 500 “catch-up” to the returns of the market leaders—versus a “catch down” where the market leaders lose ground to match their lower returning peers—but brace yourself for choppy trading before the catch-up or catch-down debate is settled in 2025.
[1] Bloomberg LP, 7/18/2025
DISCLOSURES: Information provided in this article is general in nature, is provided for informational purposes only, and should not be construed as investment advice. These materials do not constitute an offer or recommendation to buy or sell securities. The views expressed by the author are based upon the data available at the time the article was written. Any such views are subject to change at any time based on market or other conditions. Clearstead disclaims any liability for any direct or incidental loss incurred by applying any of the information in this article. All investment decisions must be evaluated as to whether it is consistent with your investment objectives, risk tolerance, and financial situation. You should consult with an investment professional before making any investment decision. Performance data shown represents past performance. Past performance is not an indicator of future results. Current performance data may be lower or higher than the performance data presented. Performance data is represented by indices, which cannot be invested in directly.
Related or Tagged New Posts

market perspectives
March 16th 2026
Research Corner | 3/16/2026
market perspectives
March 9th 2026
Research Corner | 3/9/2026

market perspectives
March 2nd 2026
Impact of Escalating Conflict in Iran
market perspectives
March 2nd 2026
Research Corner | 3/2/2026
market perspectives
February 23rd 2026
Research Corner | 2/23/2026
market perspectives
February 16th 2026
Research Corner | 2/16/2026

market perspectives
February 12th 2026
Market Update | US Dollar Debasement
market perspectives
February 9th 2026
Research Corner | 2/9/2026
market perspectives
February 2nd 2026
Research Corner | 2/2/2026
market perspectives
January 26th 2026
Research Corner | 1/26/2026
market perspectives
January 20th 2026
Research Corner | 1/20/2026

market perspectives
January 12th 2026
Quarterly Market Insights | 4Q25