OBSERVATIONS
- Markets traded lower last week with S&P 500 trading down 2.3% and small caps (Russell 2000) losing 4.2%, while the yield on the 10-year Treasury fell 17 basis points to end the week at 4.22%.[1]
- The S&P CoreLogic National Housing Price Index showed that home price appreciation continued to slow in May (latest available) with home price increases slowing to 2.3% year-over-year (YoY) which was below April’s 2.7% YoY increase.[1]
- The Fed’s preferred inflation gauge—the Personal Consumption Expenditure Index—showed that headline inflation increased to 2.6% YoY in June, up from May’s 2.4% YoY figure. Meanwhile, core-PCE—which removes volatile food and energy costs—held steady at 2.8% YoY, the same rate as in May.[1]
- Job openings decreased in June (latest available) to 7.437 million which was -275k less than in May, and there were 3.142 million quits in June, which was down from 3.27 million quits in May.[1]
- Initial unemployment claims remain low, registering only 218k new claims last week, an increase of 1,000 from the week prior—compared to 2024, initial claims were 23,500 fewer than the same week last year.[1]
- However, the latest jobs report showed that hiring slowed significantly over the summer. In July, the economy created only 73k new jobs—expectations were for about 100k new jobs—but May’s final job creation number was revised down to only 19k jobs and June’s jobs figure was revised down to 14k new jobs. The unemployment rate moved up slightly to 4.2% in July.[1]
EXPECTATIONS
- The preliminary GDP estimate showed that the US economy grew by 3.0% (annualized rate) in Q2 driven by a reversal of the surge in imports that negatively impacted Q1 GDP growth. Taken together—both Q1 and Q2—the US economy grew by about 1.2% in H1-2025 and real final sales to domestic purchasers—a good proxy for aggregate demand in the economy excluding the volatile trade and inventory components—grew by about 1.5% (annualized rate) in H1-2025.[1]
- The US Federal Reserve held rates steady last week, and while Fed Chairman Powell left the door open for a possible rate cut in September, he was non-committal emphasizing that the next few months would likely bring more clarity on the direction of inflationary pressures. Before the weak jobs report, markets had priced in only a 34% chance of a rate cut in September, but on Friday that shifted to nearly a 90% chance of a Fed rate cut in September.[1]
- So far about 66% of the S&P 500 have reported and 82% of firms have reported a positive earnings surprise, which is above the 5-year average (77%) and 10-year average (75%). The blended earnings growth for Q2 is currently 10.3% YoY)[2]
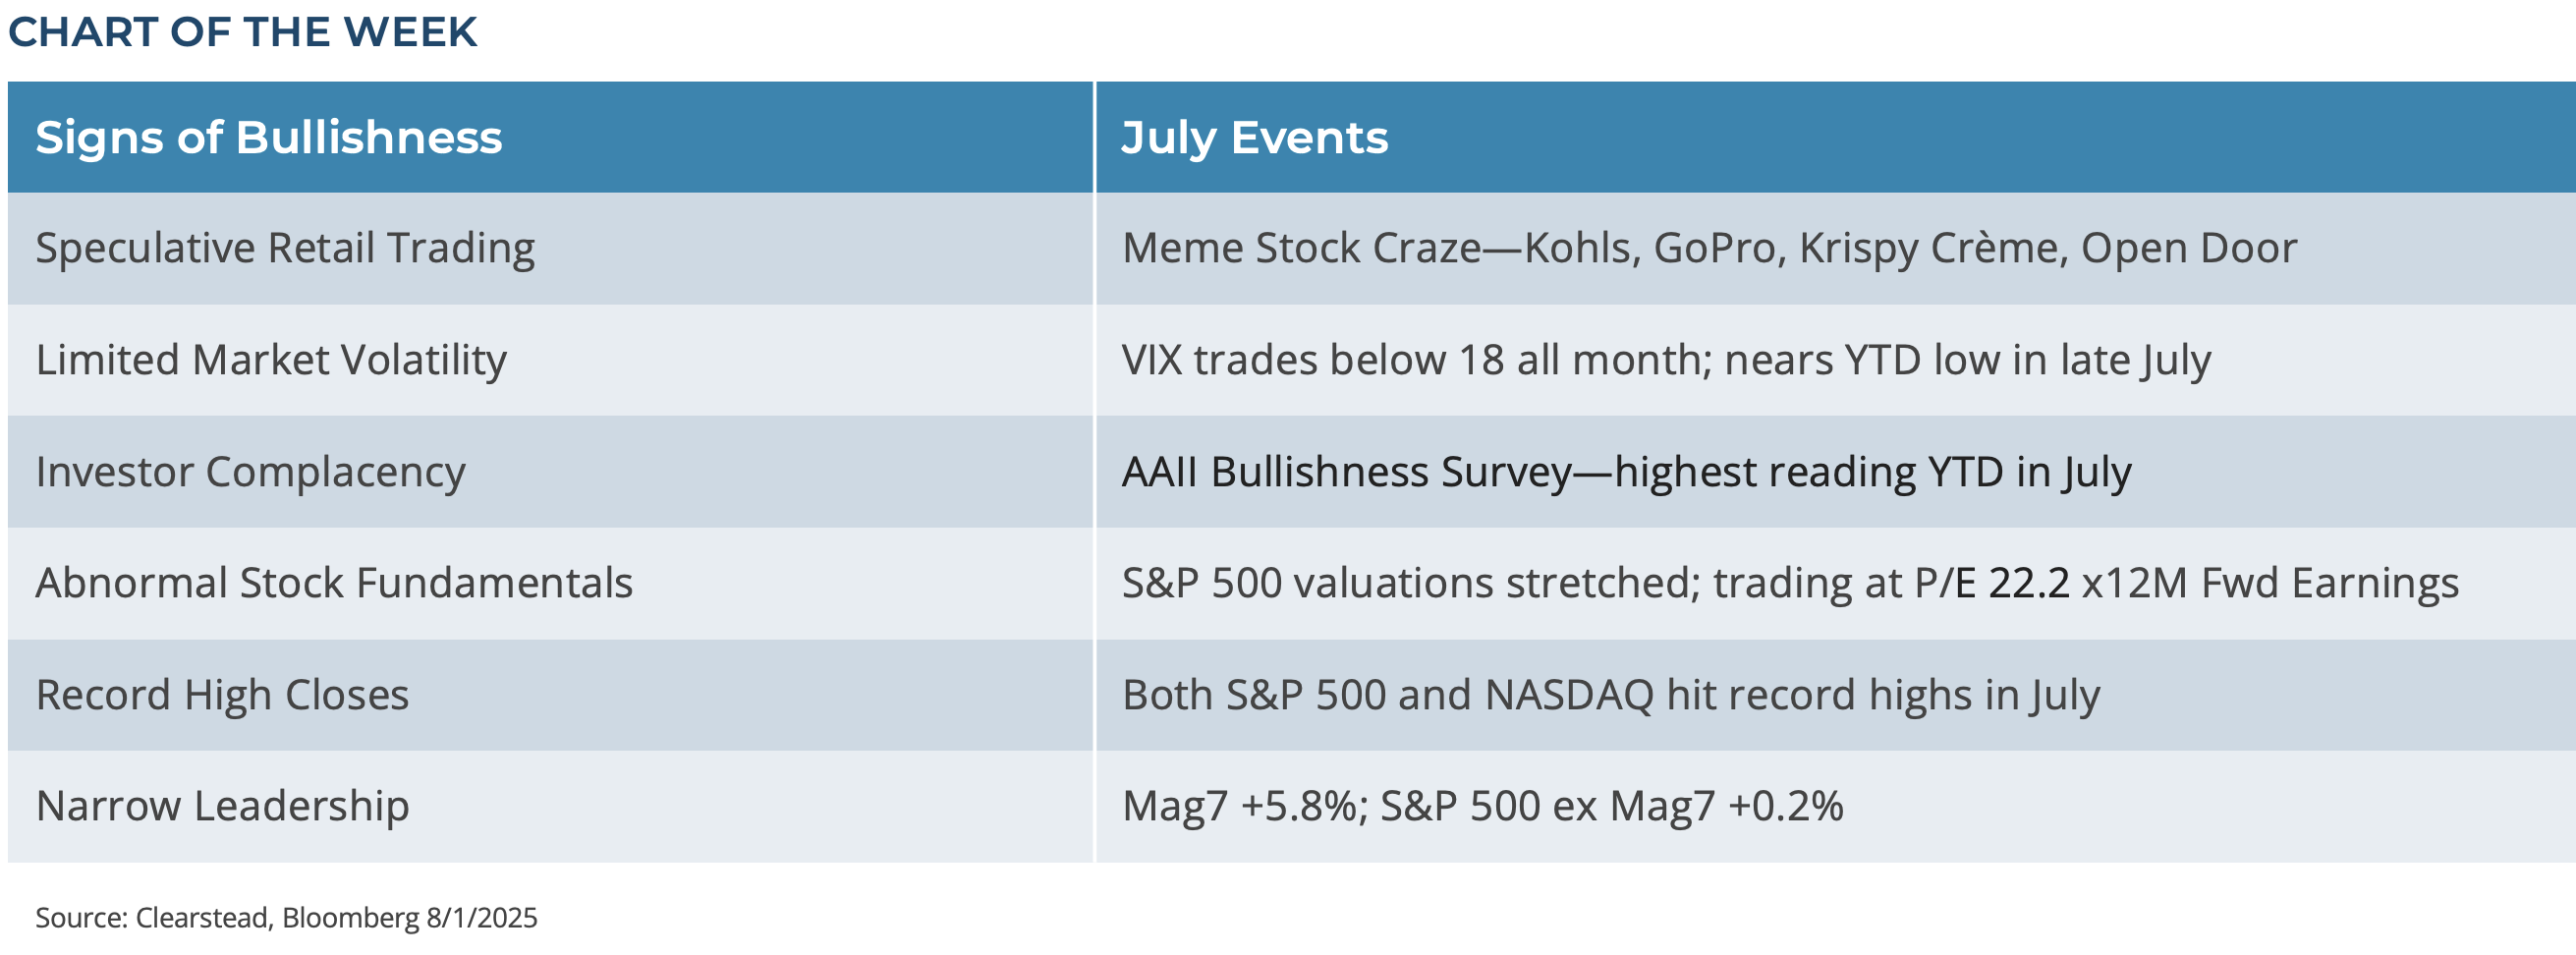
ONE MORE THOUGHT: Equity Markets Notched Steady Gains in July[1]
July was good for US equities and the S&P 500 set its 22nd record high of the year in the final week of July and the index gained 2.2% for the month. Once again, S&P 500 returns were defined by the performance of the so called Magnificent 7 (Mag 7) stocks—Alphabet, Apple, Amazon, Meta, Microsoft, NVIDIA, and Tesla—which gained 5.8% compared to the S&P 500 ex Mag 7 which gained only 0.2%. While the S&P 500 ended July near record highs, and there are signs of exuberance building within US equity markets. Markets came into July with concerns over the US’s long-term fiscal framework, with questions still hanging over several key bilateral trade deals, and apprehension about the resiliency of corporate earnings, the US economy and the US consumer. As the month progressed more clarity was brought to each of these issues. The Trump administration signed into law a new, multi-year tax and spending framework that should be largely stimulative to the economy particularly in 2026. The Trump team also negotiated several new bilateral trade frameworks that provide more clarity on the tariff landscape for the final half of the year, and Q2 earnings got off to a strong start. So far, the US consumer looks healthy, and aside from last Friday’s jobs report, most other data points had suggested at least a stable and slow growing economy. All this positive news has increasingly fed into investor complacency. July saw a resurgence of meme stocks surging in trading volume. Heavily shorted stocks such as GoPro, Kohls, and Krispy Kreme saw their shares soar over 100%, 60%, and 40% respectively at different points during the month as retail investors piled into these crowded trades. At a more basic level, the VIX Index—the so-called fear gauge—traded below 15 and came within a whisker of a year-to-date low in late July. Other measures of investor exuberance—see Chart of the Week—are consistent with heightened bullishness on the part of many investors. Last Friday’s weaker-than-expected jobs report was arguably the first piece of bad economic news since the weak Q1 GDP figure from late April, and it caused the first drop of over 1% in the S&P 500 in six weeks. This suggests that when bullishness is high and markets are priced to perfection, it doesn’t take much bad news to spur volatility and profit taking. August trading could well test Q2’s buy-the-dip mentality.

[1] Bloomberg LP, 8/1/2025
[2] FactSet Earnings Insight 8/1/2025
Information provided in this article is general in nature, is provided for informational purposes only, and should not be construed as investment advice. These materials do not constitute an offer or recommendation to buy or sell securities. The views expressed by the author are based upon the data available at the time the article was written. Any such views are subject to change at any time based on market or other conditions. Clearstead disclaims any liability for any direct or incidental loss incurred by applying any of the information in this article. All investment decisions must be evaluated as to whether it is consistent with your investment objectives, risk tolerance, and financial situation. You should consult with an investment professional before making any investment decision. Performance data shown represents past performance. Past performance is not an indicator of future results. Current performance data may be lower or higher than the performance data presented. Performance data is represented by indices, which cannot be invested in directly.
Related or Tagged New Posts

market perspectives
April 8th 2026
Quarterly Market Insights | 1Q26 Quarterly

market perspectives
April 6th 2026
Research Corner | 4/6/2026
market perspectives
March 30th 2026
Research Corner | 3/30/2026
market perspectives
March 23rd 2026
Research Corner | 3/23/2026
market perspectives
March 16th 2026
Research Corner | 3/16/2026
market perspectives
March 9th 2026
Research Corner | 3/9/2026

market perspectives
March 2nd 2026
Impact of Escalating Conflict in Iran
market perspectives
March 2nd 2026
Research Corner | 3/2/2026
market perspectives
February 23rd 2026
Research Corner | 2/23/2026
market perspectives
February 16th 2026
Research Corner | 2/16/2026

market perspectives
February 12th 2026
Market Update | US Dollar Debasement
market perspectives
February 9th 2026
Research Corner | 2/9/2026