Overview
The positive sentiment that propelled May’s equity market returns continued in June. The University of Michigan Consumer Sentiment Index increased for the first time in six months to 60.5 in June up from May’s 52.2.1 Small business optimism rose in May for the first monthly increase in 2025. The NFIB Optimism Index rose to 98.8, nearly in line with long-term averages, reflecting headlines in the past month over progress in tariff negotiations.1 The end result? The S&P 500 once again is trading at record highs. Fixed income markets posted solid returns as interest rates declined (the U.S. Treasury 10-year dropped from 4.40% to 4.23%) and spreads on high yield bonds significantly tightened.1
Since the S&P 500 bottomed early on the morning of April 9th, when the Trump administration paused a large portion of their reciprocal tariff policy, Q1 earnings surprised to the upside with over 13% YoY earnings growth, economic data continued to show a resilient US economy, and investor sentiment swung from negative to positive.1 The result was a strong snap-back and, by early June, the S&P 500 had gained over 20% in just two months. Q2’s 10.9% return of the S&P 5001—about half of which came in June—more than compensated for Q1’s losses and year-to-date the S&P has delivered a respectable 6.2%, not a bad outcome considering all the volatility witnessed so far in 2025.
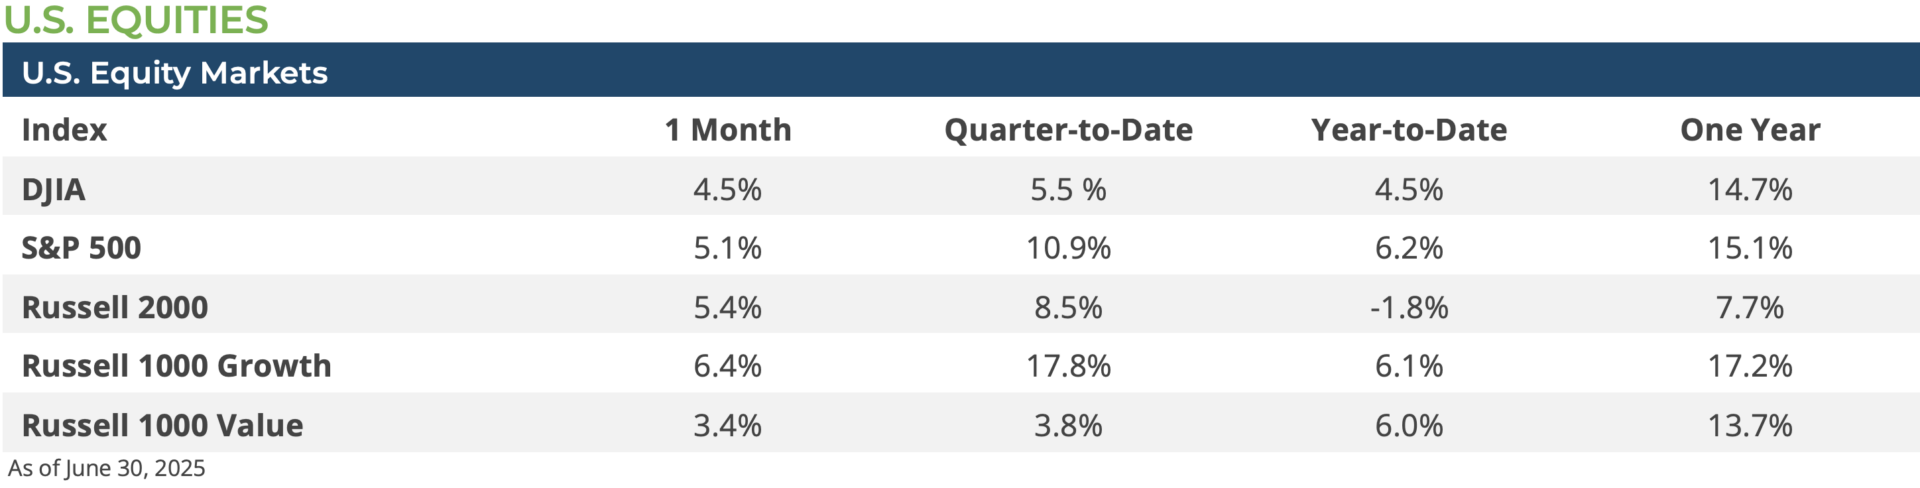
June was a good month for equities. The S&P 500 gained over 5.1%, while small caps (Russell 2000 Index) outpaced their large-cap peers and gained 5.4% during the month. June featured 20 trading days, of which 13 were positive, and the S&P 500 ended the month closing at an all-time. Growth stocks—including the Mag 7 names (Alphabet, Amazon, Apple, Meta, Microsoft, NVIDIA, and Tesla)—were some of the strongest gainers for the month. The Bloomberg Mag 7 Index gained 6.1% in June, while the broader Russell 1000 Growth Index gained 6.4%, while the Russell 1000 Value Index gained 3.4%. Most sectors registered gains in June except for the Consumer Staples (-1.9%).
June’s rise in equities confirmed the swing from negative to positive investor sentiment that began soon after the Trump administration paused most of its reciprocal tariffs for 90-days pending the outcome of bilateral trade negotiations in early April. From that point onward in Q2, equity markets began to trade higher as investors began to increasingly discount any negative tail-scenarios related to US’s evolving trade policy. By mid-May, the S&P 500 closed above its 200-day moving average and, by mid-June, the S&P 500’s 50-day moving average moved higher than its 100-day moving averaging, suggesting more positive momentum, while the VIX—the so called “fear gauge”—moved below its long-run average.1
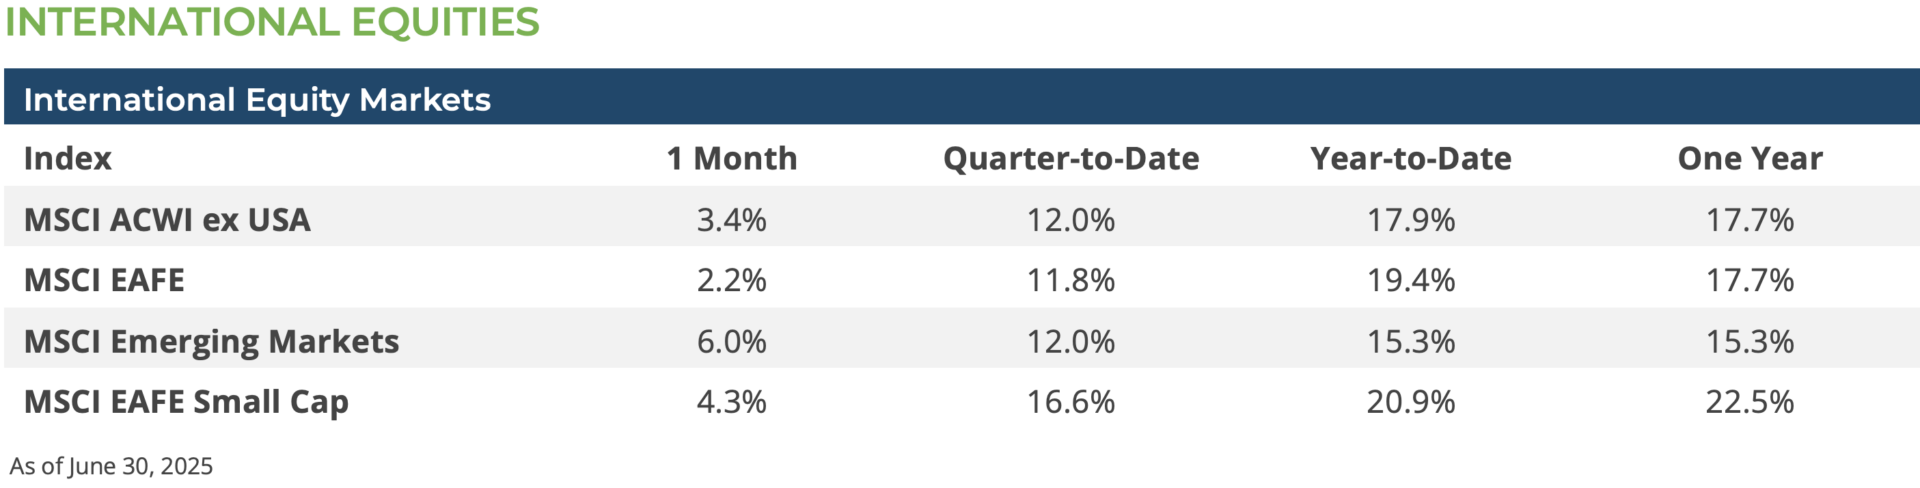
International equities also made gains in June. Developed international equities (MSCI EAFE Index) gained 2.2% and emerging market equities (MSCI EM Index) gained 6.0%. As in the US, international small cap stocks outpaced their large cap peers with the MSCI ACWI ex US Small Index gaining 4.9% while the large-cap MSCI ACWI ex US Index gained only 3.4%. International equity returns were aided by the further weakening of the US dollar which fell against several developed and emerging market currencies. The falling US dollar added about 2 percentage-points to dollar-based equity returns for international developed markets and 1 percentage-point to emerging market equity returns.2
At their June Federal Open Market Committee (FOMC) meeting, the Federal Reserve held interest rates steady and noted that the Fed desired to see the extent to which the new tariff policy had on core-inflation prices before making any further adjustments to US monetary policy. Although they maintained a “wait and see” attitude, they continued to project two rate cuts by year-end. The message here is that their desire is to lower the Fed Funds rate, but they are in no rush until the economic data supports such a response.
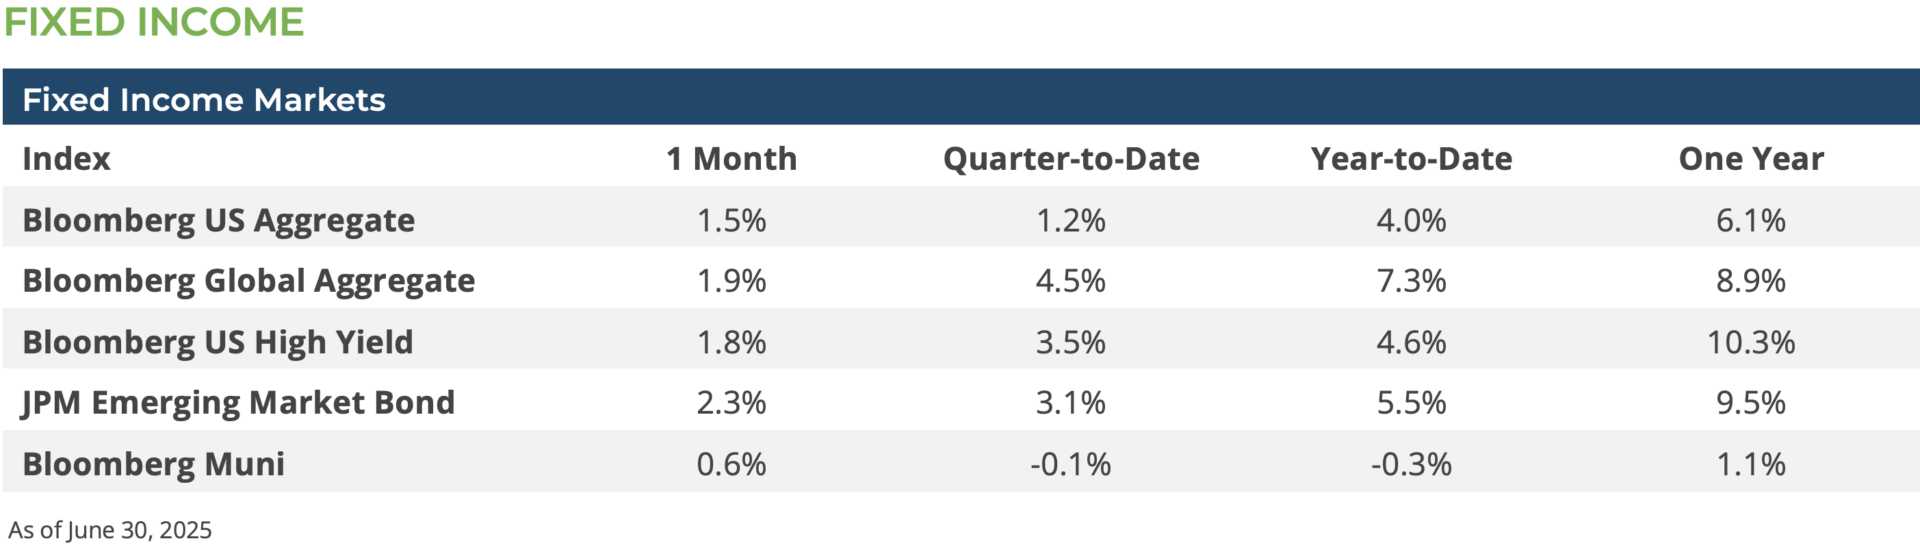
The decline in interest rates and tighter spreads led to solid returns for fixed income investors. The Bloomberg Aggregate Index gained 1.54% for the month.1 In corporate credit markets, spreads tightened in high yield bonds as equity markets rallied, and the Bloomberg Corporate High Yield Index gained 1.84% in June.1 Meanwhile, municipal bonds delivered respectable returns in June with the Bloomberg Municipal Index closing higher by 0.62%.1
Conclusion & Outlook
As we head into Q3, equity markets have a fair bit of positive momentum behind them, but they are also priced for a very positive environment in H2-2025. However, an unforeseen setback to AI-stock earnings, another adverse pivot on US tariffs, the failure of Congress to pass a budget bill, or the re-emergence of a major geopolitical shock (Ukraine, Middle East, South China Sea) could reset investor expectations, and we could see financial market volatility re-assert itself in the weeks and months ahead. Additionally, financial markets would be disappointed should inflation trend higher and the Fed choose to delay easing back on monetary policy (i.e. lower the Fed Funds rate). Given these storm clouds that hang over the markets it would be easy to believe that the best days of 2025 are behind us, but time and again, the surprising strength of the U.S. economy and corporate fundamentals continue to surprise investors. As we witnessed in the first half of 2025, there might be considerable volatility, but the financial markets appear to be biased to the upside and reward those who stay invested and play the long game.
[1] Bloomberg LP 6/30/2025
[2] MSCI Global Index Lens – Index Returns 6/30/2025
DISCLOSURES: Information provided in this article is general in nature, is provided for informational purposes only, and should not be construed as investment advice. The views expressed by the author are based upon the data available at the time the article was written. Any such views are subject to change at any time based on market or other conditions. Clearstead disclaims any liability for any direct or incidental loss incurred by applying any of the information in this article. All investment decisions must be evaluated as to whether it is consistent with your investment objectives, risk tolerance, and financial situation. The performance data shown represent past performance. Past performance is not an indicator of future results. Current performance data may be lower or higher than the performance data presented.
Related or Tagged New Posts

market perspectives
April 1st 2026
March Review 2026
market perspectives
March 2nd 2026
February Review 2026

market perspectives
February 17th 2026
Beyond the Agg
market perspectives
February 2nd 2026
January Review 2026
market perspectives
January 6th 2026
December Review 2025
market perspectives
December 1st 2025
November Review 2025

market perspectives
December 1st 2025
Market Update | Private Credit
market perspectives
November 3rd 2025
October Review 2025
market perspectives
October 1st 2025
September Review 2025
market perspectives
September 2nd 2025
August Review 2025
market perspectives
August 1st 2025
July Review 2025
market perspectives
June 2nd 2025
May Review 2025