
Introduction
On December 5, 1996, then Federal Reserve Board Chairman Alan Greenspan delivered what we now refer to as the ‘irrational exuberance’ speech — formally titled “The Challenge of Central Banking in a Democratic Society.” “Clearly, sustained low inflation implies less uncertainty about the future, and lower risk premiums imply higher prices of stocks and other earning assets. We can see that in the inverse relationship exhibited by price/earnings ratios and the rate of inflation in the past. But how do we know when irrational exuberance has unduly escalated asset values, which then become subject to unexpected and prolonged contractions as they have in Japan over the past decade?”1 At the time of Greenspan’s speech, the S&P 500 experienced an extraordinary rally of 72.3% over the two years (12/5/1994 to 12/5/1996) leading up to the now famous speech.2 The S&P would go on to more than double in the three plus years following the speech.2 From 12/5/1996 to the eventual dot-com era peak on March 23, 2000, the index gained 115.5% or 26.2% on an annualized basis.2
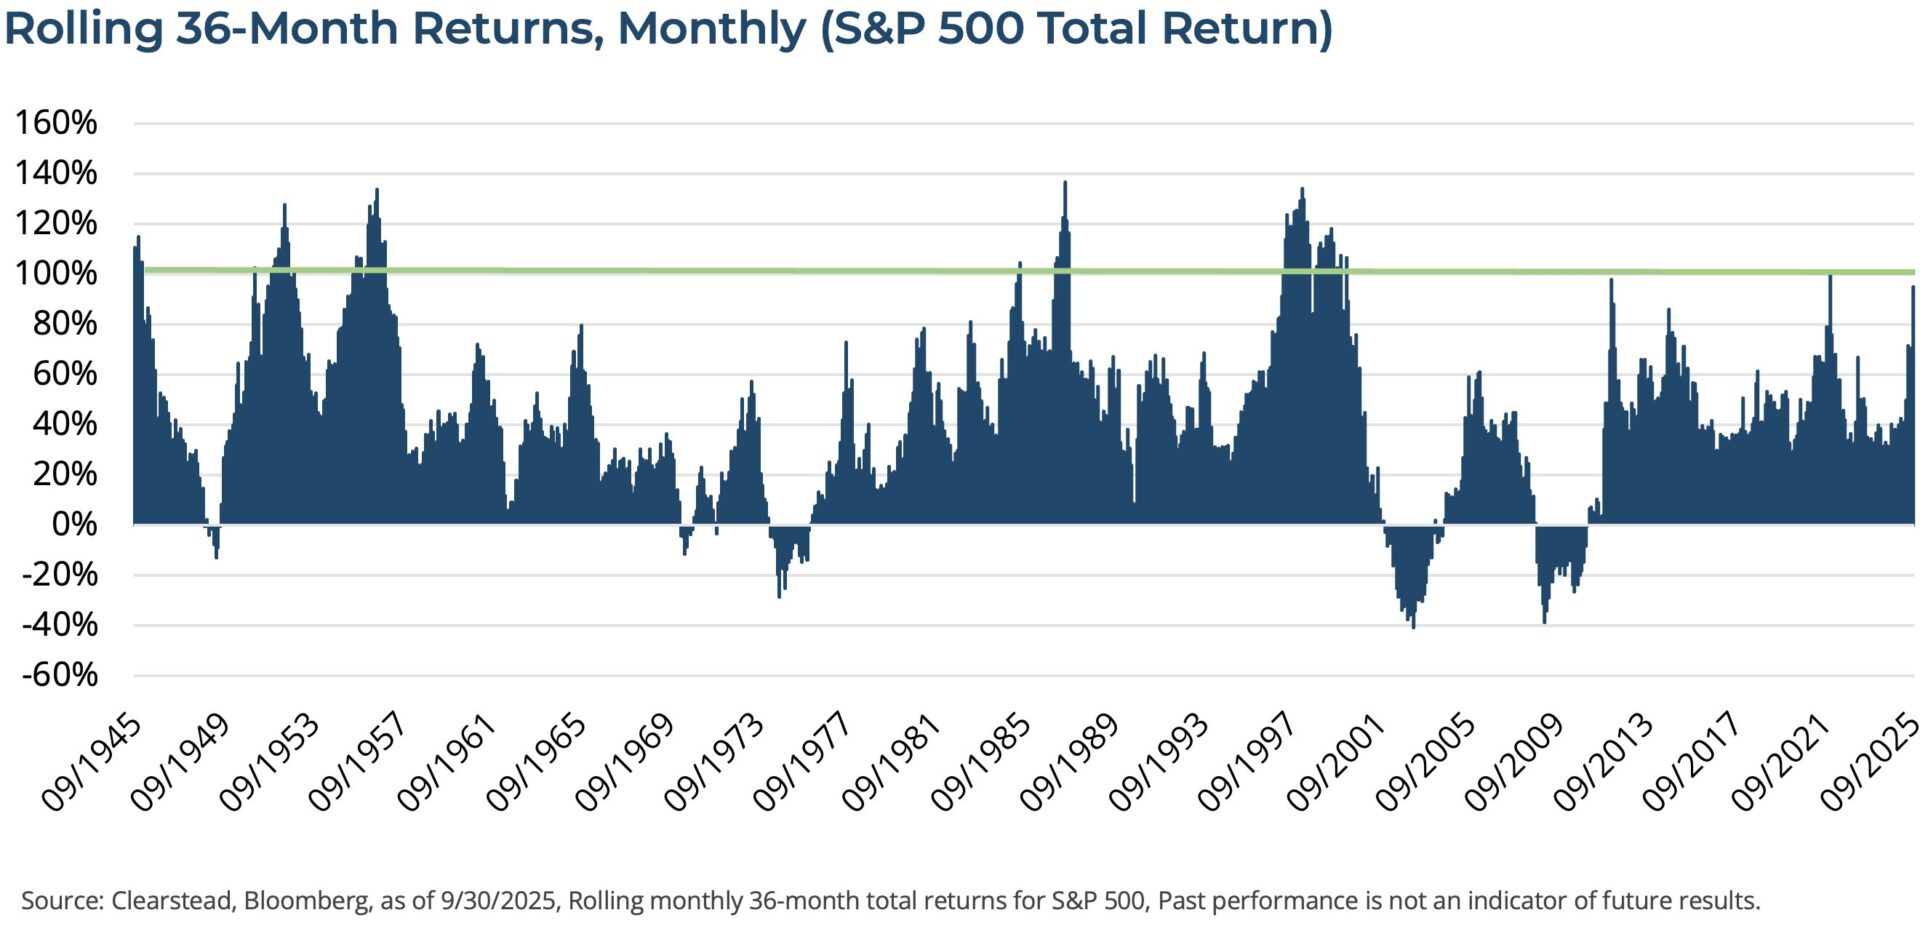
Today, like then, the S&P 500 has experienced significant momentum and a rally that rivals the dot-com era accompanied by stretched valuations and a wide sense of disbelief in the sustainability for the upward bias seen in markets — the S&P 500 has gained 95% over the three-year period ending 9/30/2025.2
Dot-com 2.0?
As in the late 1990s, it is a new technology that is at the center of the extraordinary gains made over the past few years. In the 1990s it was the internet, which was the key technology of the information superhighway that would revolutionize retail sales, supply chains, and usher in a new age of productivity. Indeed, over the coming decade or so, much of this came to pass. The internet became a growing place to make sales and advertise, as nearly free and instantaneous communication across continents enabled global supply chains to develop and productivity gains were made across wide portions of the US economy. However, the valuations that investors were willing to pay for the S&P 500 at the end of the dot-com period left a hangover, and it took the S&P 500 almost seven years,until mid-2007, to regain its dot-com era highs. Many investors are now asking us, are we headed for a similar scenario, whereby the exuberance over AI eventually leads to a bust?
Valuations are Poor Timing Mechanisms
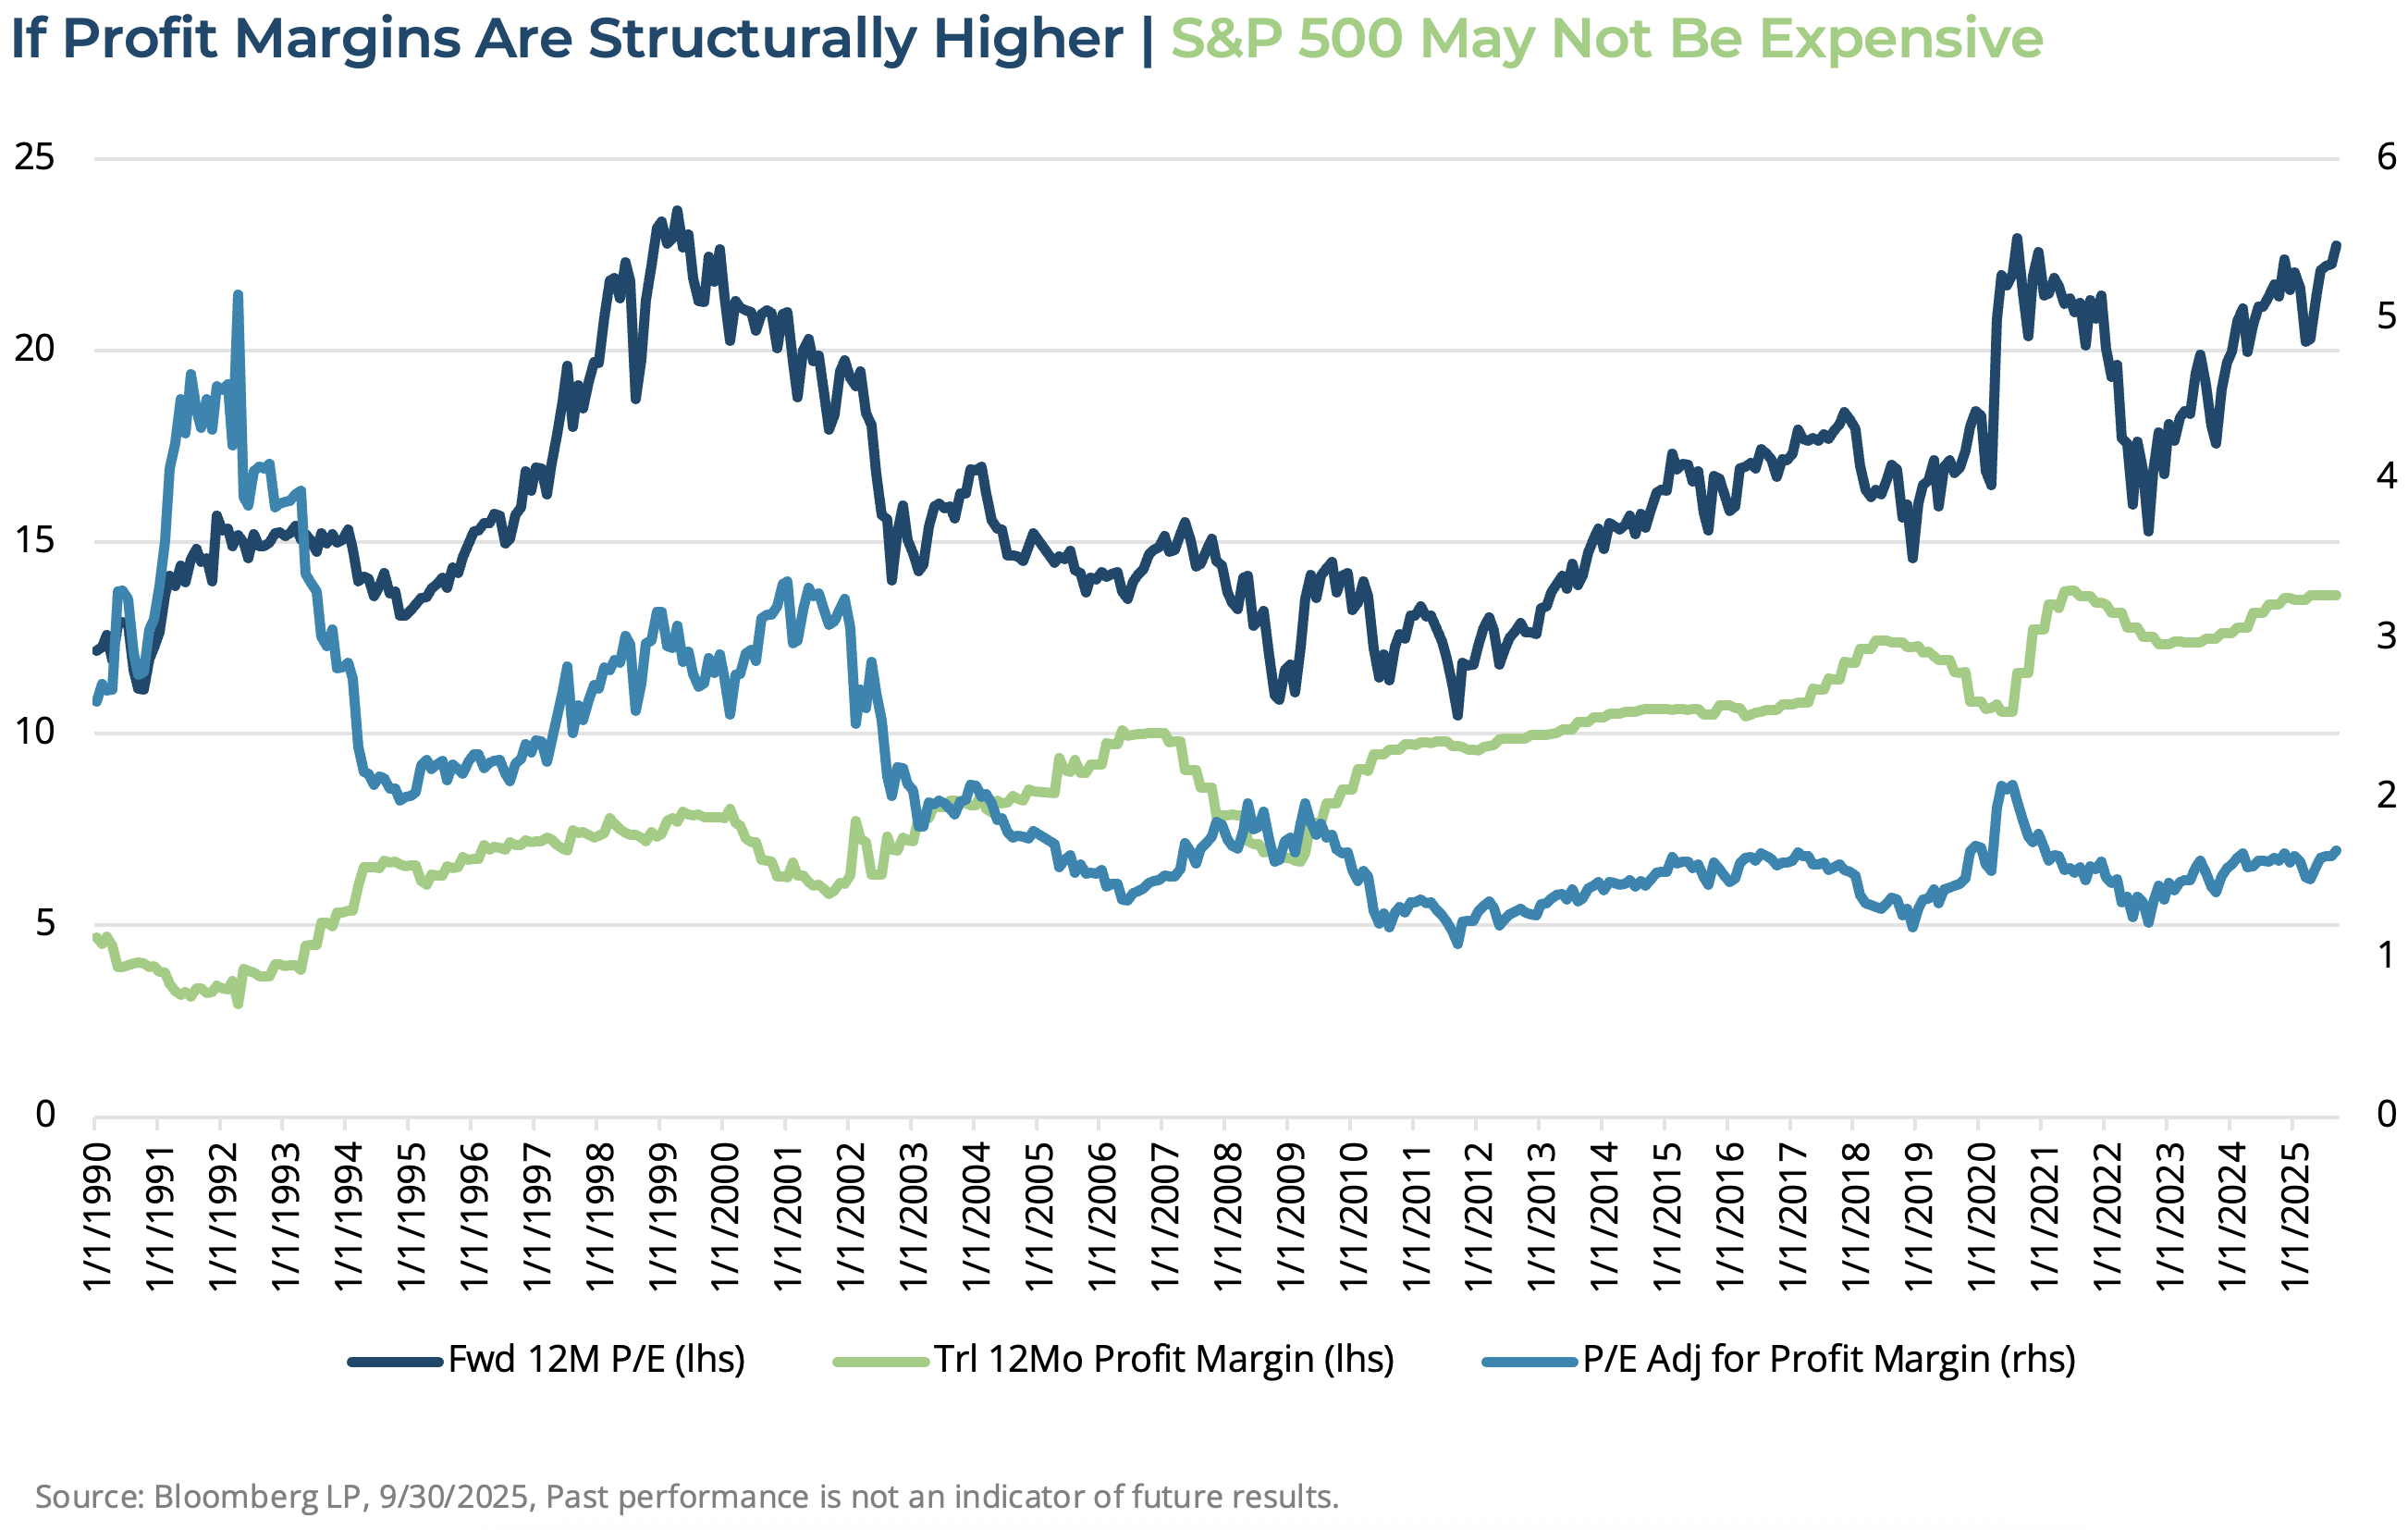
As we look at valuations today, it is undeniable that they should be considered stretched. As of the end of September, the forward 12-month Price-to-Earnings multiple on the S&P 500 was 22.8. This figure is not far below the peak multiple we saw after the Covid-pandemic re-opening trade (22.9) in 2020 and the dot-com high (23.7)—see chart below.2 While this figure should not be ignored, history suggests (at minimum) that the rally could continue for some time, and the multiple could grind even higher. Additionally, during the period of the 1990s, the profit margin for the S&P 500 was roughly in-line with its long-run average which prior to 2010 was roughly in mid-to-high single digits—roughly 6% to 8%.2 However, since the GFC, the S&P 500 has seen record profits and record profit margins which have been above 10% for nearly all the past 15 years.2 Now some may argue that this is a further cause to worry in that these profit margins may mean revert to the long-run average (sub-10%). But there is perhaps a greater probability, that because the US economy is now less cyclical, less capital intensive, less energy intensive and increasingly dominated by high-quality (low debt levels) technology firms, that the profit margins of the last decade are here to stay. If that is the case, then the companies that comprise the S&P 500 could reasonably command higher premium than was appropriate in the 1990s.
Booms Precede Bubbles
We are not saying that the current market environment is without risks or that all the hoopla surrounding the AI-trade is fully justified. So far, we have taken solace in the fact that most of the AI capex spending has come from the largest US tech firms—such as Microsoft, Google, Amazon and Meta—and it has been funded primarily via these large tech firms’ free cash flow. However, the recent news surrounding many AI deals involving cross-investments between NVIDIA, its customers (like Microsoft and Meta), the AI model developers (OpenAI and Anthropic), as well the implicit use of leverage in the coming years to fund some of this AI development raises several cautionary flags. Still, the old adage bears repeating that, before a bubble can be formed, a boom must ensue and, at this point, one can credibly look at the recent earnings of most of the companies at the center of the AI trade and conclude we are more likely in the boom phase rather than in the middle of a bubble.
Conclusion
One should not conclude that in any way Clearstead is biased toward complacency. As the range of outcomes for this year have widened, we have been vigilant in our rebalancing efforts with an aim of keeping our risk-assets—US/global large cap growth, US large cap, and other risk positions—at target. Should the market continue to grind higher in the coming quarters, Clearstead may further trim some of the gains associated with US growth and tech positions in favor of lower-beta, more-value oriented positions. While the economic and profit dynamic that underpin today’s market gains looks reasonable, Clearstead remains clear-eyed about the risks of the AI boom potentially transitioning to an AI bubble in the periods ahead.
[1] https://www.federalreserve.gov/boarddocs/speeches/1996/19961205.htm
[2] Bloomberg LP, 9/30/2025
Disclosures: information provided in this article is general in nature, is provided for informational purposes only, and should not be construed as investment advice. The views expressed by the author are based upon the data available at the time the article was written. Any such views are subject to change at any time based on market or other conditions. Clearstead disclaims any liability for any direct or incidental loss incurred by applying any of the information in this article. All investment decisions must be evaluated as to whether it is consistent with your investment objectives, risk tolerance, and financial situation. The performance data shown represent past performance. Past performance is not an indicator of future results. Current performance data may be lower or higher than the performance data presented.
Related or Tagged New Posts

market perspectives
April 8th 2026
Quarterly Market Insights | 1Q26 Quarterly

market perspectives
April 6th 2026
Research Corner | 4/6/2026
market perspectives
March 30th 2026
Research Corner | 3/30/2026
market perspectives
March 23rd 2026
Research Corner | 3/23/2026
market perspectives
March 16th 2026
Research Corner | 3/16/2026
market perspectives
March 9th 2026
Research Corner | 3/9/2026

market perspectives
March 2nd 2026
Impact of Escalating Conflict in Iran
market perspectives
March 2nd 2026
Research Corner | 3/2/2026
market perspectives
February 23rd 2026
Research Corner | 2/23/2026
market perspectives
February 16th 2026
Research Corner | 2/16/2026

market perspectives
February 12th 2026
Market Update | US Dollar Debasement
market perspectives
February 9th 2026
Research Corner | 2/9/2026