OBSERVATIONS
- Markets traded higher last week with the S&P 500 gaining 1.7% and small caps (Russell 2000) gaining 2.4%, while the yield on the 10-year Treasury fell 2 basis points to end the week at 4.01%.[1]
- The Small Business Optimism Index declined 2 points in September to 98.8 from August’s 100.8 level, marking the first decline in three months but remaining above the long-run average of 98.[1]
- Due to the US Government shutdown, retail sales figures for September were not released, but the private sector Redbook Weekly Same-Store Sales data showed that weekly sales averaged about 6.1% year-over-year (YoY) growth in September—on par with gains made in August.[1]
EXPECTATIONS
- Q3 earnings season kicked-off last week to a strong start from the leading US banks. JPMorgan, Bank of America, Wells Fargo, Morgan Stanley, Goldman Sachs, and Citigroup all saw increases in quarterly profits—collectively topping $41 billion in the quarter and up 19% YoY.[2]
- There have been several credit events in recent weeks relating to the bankruptcies of First Brands ($5 billion annual revenues) and Tricolor Holdings ($130 million annual revenues) along with a $50 million dollar write-off by Zions Bancorp after a loan went bad due to alleged fraud by a borrower—Western Alliance Bank also noted exposure to the alleged fraud. So far, these events seem idiosyncratic and not systemic, but credit markets will be increasingly on edge if more large defaults occur in Q4.[1]
- The Fed beige book released last week suggests little or no change in economic activity in September as three of the twelve Fed Districts reported slight to modest growth in activity, five reported no change in economic activity, and four noted a slight softening.[1]
- The US Government shutdown entered its third week and there seems to be little progress between Democrats or Republicans towards a compromise. The administration was able to re-allocate funds earmarked for defense spending in order to pay active-duty military on time last week, but other furloughed government workers received only a partial paycheck last week representing the final days worked in September. If the shutdown does not end soon, most government workers will miss a full paycheck at the end of the month and the economic losses related to the shutdown will begin to truly mount.[1]
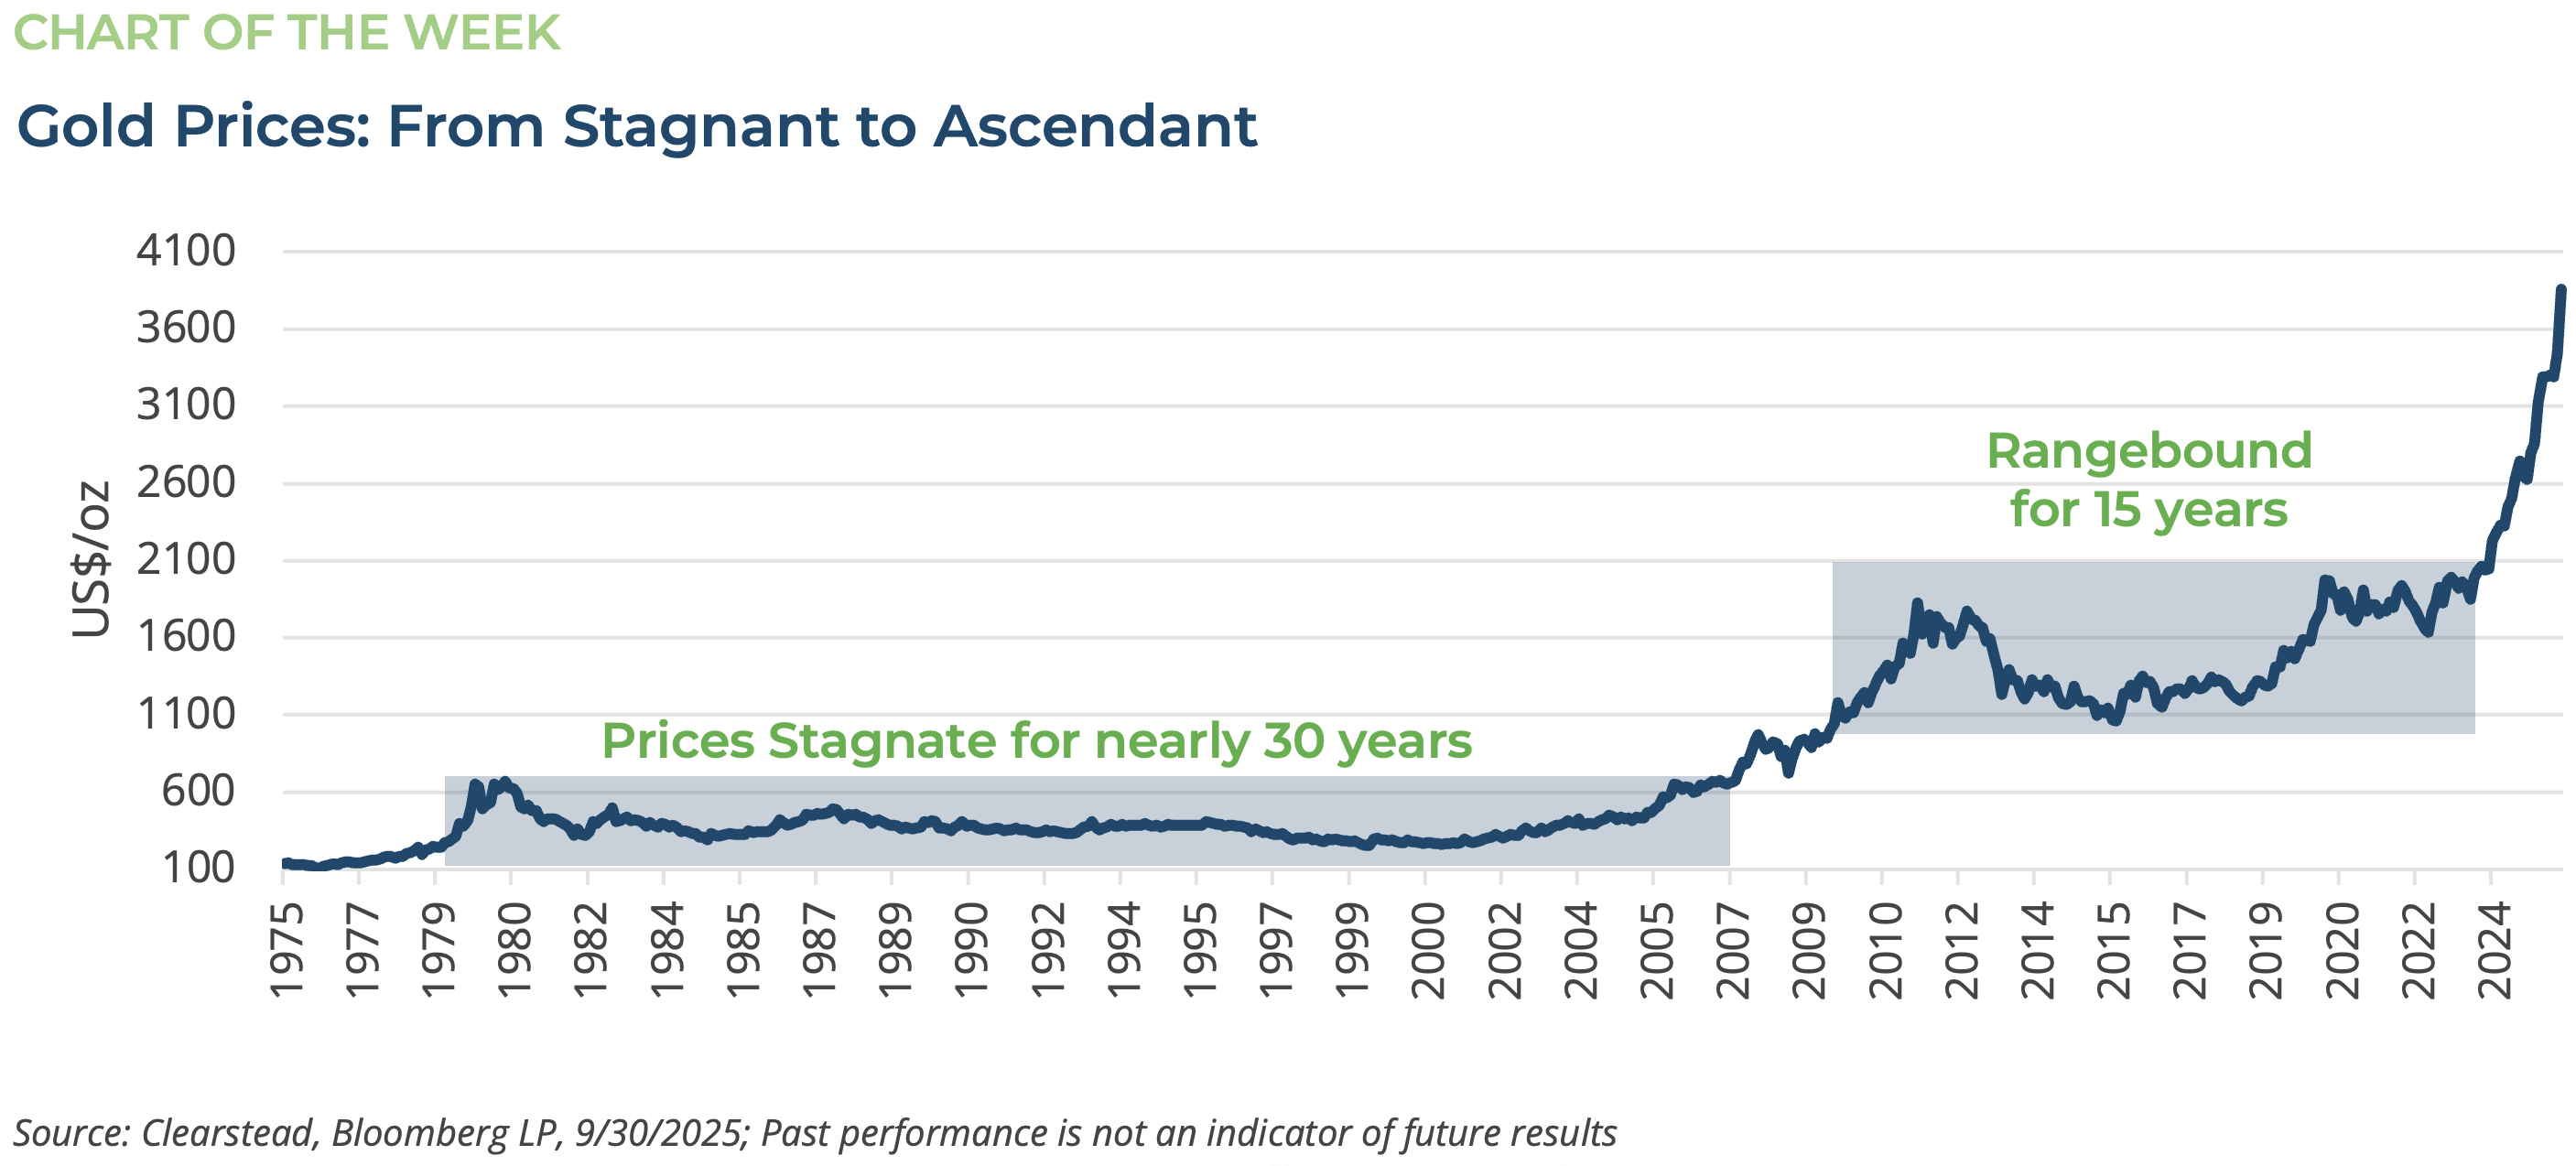
ONE MORE THOUGHT: All That Glitters Is Gold[1]
Gold is having a moment. It is up over 60% year-to-date (YTD). Moving from $2,650 a troy ounce to over $4,300 last week. What is driving this surge in gold prices this year? How high could gold prices go? There are several factors at play with gold prices at present. Structural buying, which has been elevated in recent years, stems from both foreign central banks as well as rising overall global wealth levels. Foreign central banks have been adding to their gold reserves over the past five years, in part because the US was so successful in freezing Russian financial assets—primarily dollar-based assets (cash equivalents, bonds and other financial assets)—after it invaded Ukraine in 2022. Given that Russia was unable to evade sanctions, particularly on its dollar and euro-based assets—many central banks have been increasing their purchases of physical gold and storing them either at home or in neutral, non-aligned countries. Secondarily, as the global middle class has expanded in recent years—much of this growth has taken place in south Asia—these households have turned to gold as a preferred option to invest extra money. While these two phenomena can explain some of the increase in gold prices over the past few years, they cannot alone explain the near tripling of gold prices since the beginning of the Covid Pandemic nor the strong surge in gold prices YTD. Two other interrelated factors are likely driving some of the recent surges in gold prices. One is the notion of global currency debasement. In many countries, including the US, governments have been unwilling to rein in spending and reduce their economies’ overall debt levels. Recently the IMF projected that global government debt is likely to rise above 100% of global GDP in the next few years. As result, investors are starting to fear the global price levels (inflation) will rise more quickly than previously appreciated. Hence, gold is acting as a hedge against the risk that global inflation surprises to the upside more than in decades past. Lastly, it is speculation and momentum. In the mid-to-late 1970s gold also surged in value as US inflation spiked and the removal of the US from the gold standard ushered in a period of global currency volatility. Gold prices moved up less than $100 per ounce to a high of over $800 per ounce before settling down to a range of about $350 to $450 per ounce. In those days, physical gold—bars, coins, or jewelry—had to be purchased and those that chased investments in the late innings of the gold rally in 1979 and 1980 had unrealized losses for over 25 years—gold prices did not move above $600 an ounce again until 2006. Today, one can buy fractional amounts of gold—physically or via an ETF. Purchases can be made on your phone or by a click of the mouse, which has the potential to only feed the gold frenzy even more than in past rallies. Gold prices could still increase from here and may eventually top $5,000 an ounce, but as was the case in the 1980s, chasing the rally as it nears a possible top could lead to buyers’ remorse in the long-run.
[1] Bloomberg, LP 10/17/2025
[2] https://www.wsj.com/finance/banking/te-nations-biggest-banks-are-saying-the-economy-is-still-strong-689a0d63?mod=article_inlin
Information provided in this article is general in nature, is provided for informational purposes only, and should not be construed as investment advice. These materials do not constitute an offer or recommendation to buy or sell securities. The views expressed by the author are based upon the data available at the time the article was written. Any such views are subject to change at any time based on market or other conditions. Clearstead disclaims any liability for any direct or incidental loss incurred by applying any of the information in this article. All investment decisions must be evaluated as to whether it is consistent with your investment objectives, risk tolerance, and financial situation. You should consult with an investment professional before making any investment decision. Performance data shown represents past performance. Past performance is not an indicator of future results. Current performance data may be lower or higher than the performance data presented. Performance data is represented by indices, which cannot be invested in directly.
Related or Tagged New Posts

market perspectives
April 8th 2026
Quarterly Market Insights | 1Q26 Quarterly

market perspectives
April 6th 2026
Research Corner | 4/6/2026
market perspectives
March 30th 2026
Research Corner | 3/30/2026
market perspectives
March 23rd 2026
Research Corner | 3/23/2026
market perspectives
March 16th 2026
Research Corner | 3/16/2026
market perspectives
March 9th 2026
Research Corner | 3/9/2026

market perspectives
March 2nd 2026
Impact of Escalating Conflict in Iran
market perspectives
March 2nd 2026
Research Corner | 3/2/2026
market perspectives
February 23rd 2026
Research Corner | 2/23/2026
market perspectives
February 16th 2026
Research Corner | 2/16/2026

market perspectives
February 12th 2026
Market Update | US Dollar Debasement
market perspectives
February 9th 2026
Research Corner | 2/9/2026