OBSERVATIONS
- Markets traded higher last week as the S&P 500 gained 1.9% and small caps (Russell 2000) rose 2.5% and the yield on the 10-year Treasury fell 1 basis points to end the week at 4.0%. Meanwhile gold suffered its worst one-day loss (last Tuesday down 5.3%) in twelve years and broke a 9-week winning streak by declining -3.3% last week.[1]
- Existing home sales came in at 4.06 million (annualized rate) in September, which was an increase of 1.5% month-over-month (MoM) from August’s 4.0 million sales rate.[1]
- The Architectural Billing Index—a leading indicator of non-residential construction—registered a 43.3 reading in September (any number below 50 signals contracting economic activity), down from August’s 47.2 reading. This Index has indicated contracting activity for 34 of the past 36 months.[1]
- Core inflation (CPI excluding food and energy) rose 0.2% on a MoM basis and 3.0% on a year-over-year (YoY) basis—lower than expectations of .03% and 3.1%, respectively.[1]
EXPECTATIONS
- The government shutdown is only a week away from being the longest federal shutdown in history and, so far, neither party looks ready to compromise and begin the negotiations needed to re-open the government. This means it is highly likely that most furloughed government workers—more than 750k employees—will miss their first full paycheck, which in turn could blunt retail spending in select regions.[1]
- Later this week the Federal Reserve will meet to review its interest rate policy, and the Fed Funds Futures market suggests a 97% probability that the Fed will lower its main policy interest rates by 25 basis points to a range of 3.75% to 4.00%—marking the first time the mid-point of the Fed’s policy rate will be below 4% since November-2022. Currently, markets further expect a second 25 basis point rate cut (100% probability) when they meet next in mid-December.[1]
- Q3 earnings season is off to good start, with 29% of the S&P 500 having reported, the number of companies with a positive earnings surprise in Q3 was 87%, which was above the 5-year (78%) and 10-year (75%) averages. Overall, Q3 earnings are tracking to increase by 9.2% YoY.[2]
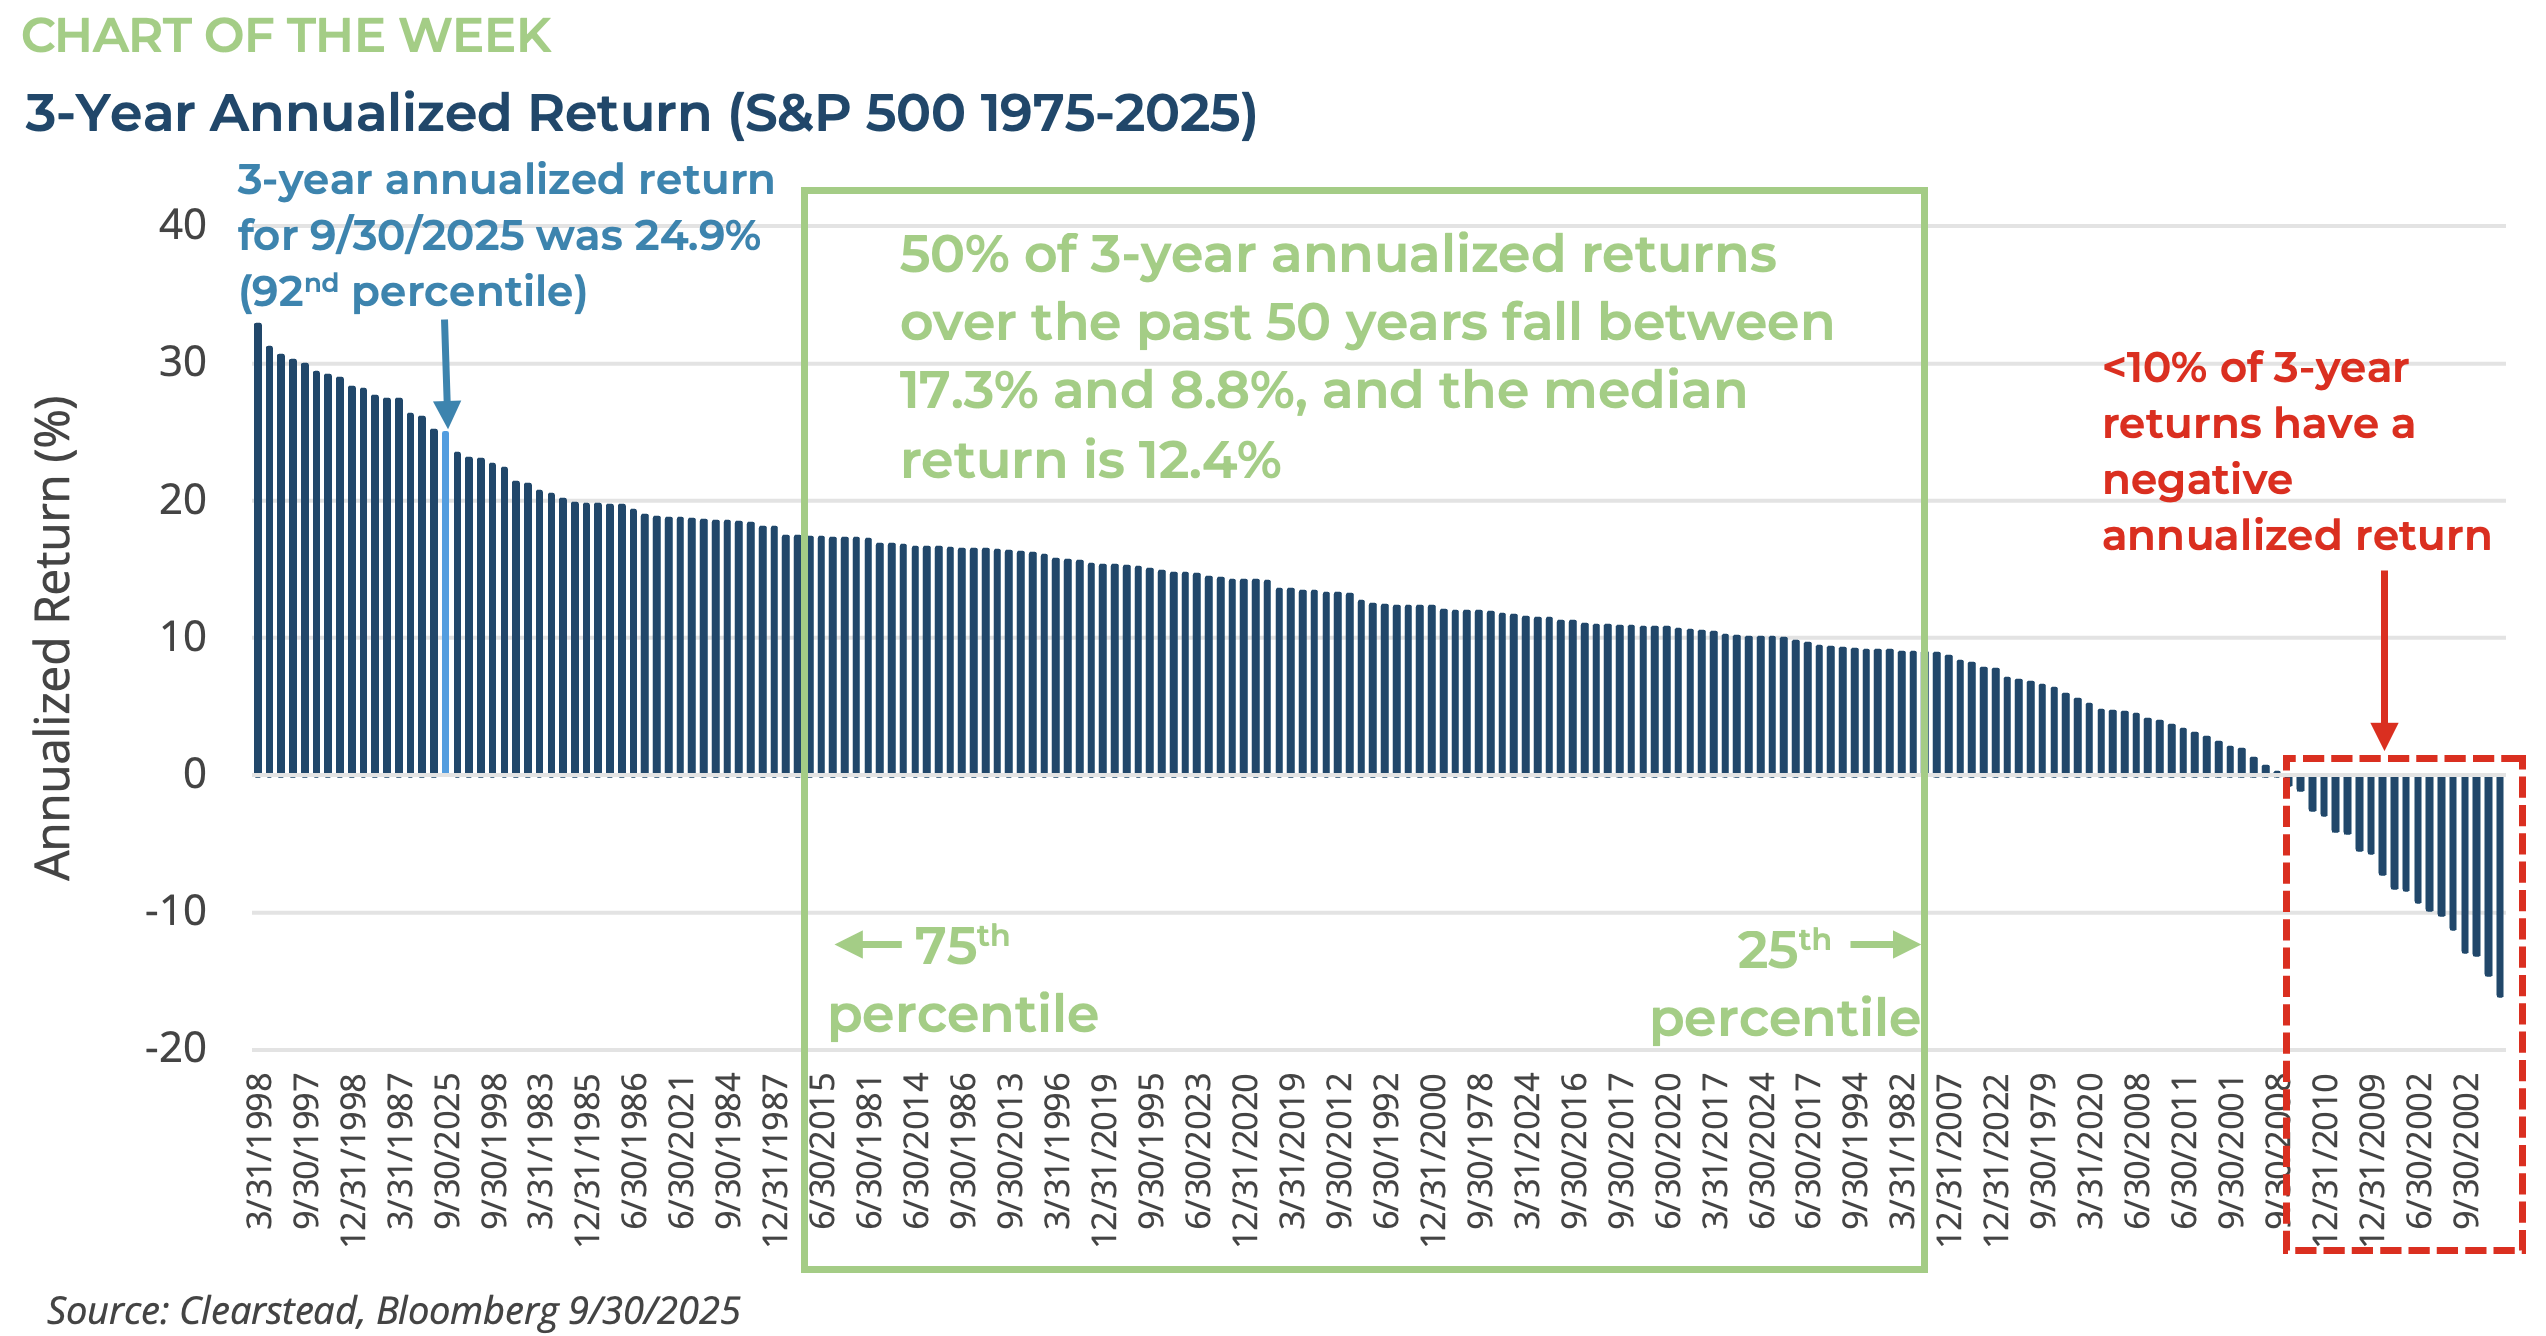
ONE MORE THOUGHT: Three years of Strong Gains for the S&P 500[1]
It may seem a lifetime ago, but just three years ago the S&P 500 had hit its low in the 2022-2023 bear market. From 3-Jan-2022 to 30-Sep-2022 the S&P 500 lost over 25.3%. The catalyst for that bear market had been the surge of inflation and the Fed hiking cycle that began in March-2022 to choke off the inflationary pressures. By the middle of Oct-2022, markets noticed that inflation seemed to have peaked in the late summer, and the US economy had (thus far) been able to manage the increase in the Fed’s policy rates. Thus, the market began to rebound. Over the next three years we witnessed steady progress towards lower inflation, stable economic growth, strong corporate earnings, and a resilient labor market. In H2-2023, the AI trade began to move to the forefront of investors’ focus, and the markets truly began to move higher. Fast-forward to this past September, at the close of Q3, the S&P 500 has returned 24.9% (annualized) over the period 1-Oct-2022 to 30-Sep-2025. This is an incredible 3-year return and not something that investors should expect given historical patterns for equity returns. In fact, over the past 50-years, a nearly 25% annualized return over a three-year period is in the 90th percentile for S&P 500 returns—see Chart of the Week. In the past 50 years there have been only 16 other occurrences of quarters ending with higher 3-year annualized returns and nearly 70% of these periods occurred in the late 1990s during the height of the dot-com bubble. It is precisely because recent years brought returns on-par with some of the best days of the dot-com bubble that many investors are becoming nervous as the S&P 500 grinds higher today. There are a few things to consider when we compare the AI boom with the dot-com bubble. One is that while valuations today are elevated relative to history they are still not as high as the height of the dot.com bubble. In addition, the profit margins of the S&P 500 are higher now than they were in the late 1990s—and appear to have moved structurally higher over the past decade—and therefore may deserve a higher premium than in the past. Lastly, the second highest 3-year return at the end of a quarter since 1975 came in Dec-1997 and yet the S&P 500 went on to gain more than 50% (cumulative) over the next two years. While the gains of the past few years have been exceptional, the positive momentum in the market is likely to continue so long as earnings and the economy continue to grind higher.
[1] Bloomberg LP, 10/24/2025
[2] FactSet Earnings Insight 10/24/2025
Information provided in this article is general in nature, is provided for informational purposes only, and should not be construed as investment advice. These materials do not constitute an offer or recommendation to buy or sell securities. The views expressed by the author are based upon the data available at the time the article was written. Any such views are subject to change at any time based on market or other conditions. Clearstead disclaims any liability for any direct or incidental loss incurred by applying any of the information in this article. All investment decisions must be evaluated as to whether it is consistent with your investment objectives, risk tolerance, and financial situation. You should consult with an investment professional before making any investment decision. Performance data shown represents past performance. Past performance is not an indicator of future results. Current performance data may be lower or higher than the performance data presented. Performance data is represented by indices, which cannot be invested in directly.
Related or Tagged New Posts

market perspectives
March 16th 2026
Research Corner | 3/16/2026
market perspectives
March 9th 2026
Research Corner | 3/9/2026

market perspectives
March 2nd 2026
Impact of Escalating Conflict in Iran
market perspectives
March 2nd 2026
Research Corner | 3/2/2026
market perspectives
February 23rd 2026
Research Corner | 2/23/2026
market perspectives
February 16th 2026
Research Corner | 2/16/2026

market perspectives
February 12th 2026
Market Update | US Dollar Debasement
market perspectives
February 9th 2026
Research Corner | 2/9/2026
market perspectives
February 2nd 2026
Research Corner | 2/2/2026
market perspectives
January 26th 2026
Research Corner | 1/26/2026
market perspectives
January 20th 2026
Research Corner | 1/20/2026

market perspectives
January 12th 2026
Quarterly Market Insights | 4Q25