OBSERVATIONS
- Markets moved higher last week after a strong ending to Q1 earnings season with the S&P gaining 1.9% and small caps (Russell 2000) up 1.3%, while the yield on the 10-year Treasury fell 11 basis points to 4.40%.[1]
- Durable goods orders fell -6.3% month-over-month (MoM) in April after March’s large increase, which was revised down to 7.6% MoM. This suggests that companies brought forward a lot of purchases in March ahead of April’s tariff announcements, particularly in the auto sector. Excluding transportation—airplanes and autos—durable goods orders actually increased 0.2% MoM.[1]
- The S&P CoreLogic CS Housing price index showed that national housing price increases slowed to a 3.4% year-over-year (YoY) rate in March, which was lower than February’s 4.0 YoY increase.[1]
- The headline PCE price index—the Fed’s preferred gauge of inflation—fell to 2.1% YoY in April down from March’s 2.3% YoY figure, while core-PCE, which removes volatile food and energy prices, fell to 2.5% YoY down from March’s 2.7% YoY core-PCE figure.[1]
- Initial unemployment claims rose last week to 240k—which was more than expected and a 14k increase in claims from the year prior—but still remain low relative to history.[1]
EXPECTATIONS
- The latest Federal Reserve meeting minutes showed that the Fed was focused on the economic impact of the Trump administration’s tariff policy and on balance the minutes suggest that they seemed to place greater weight on the risks of tariffs increasing inflation rather than harming growth and employment.[1]
- With nearly 98% of firms having reported Q1 earnings, including NVIDIA last week, Q1 earnings have been strong, showing 13.3% YoY earnings growth. Overall, 78% of firms have reported a positive earnings surprise, which was above both the 5-year (77%) and 10-year (75%) average for positive earnings surprises.[2]
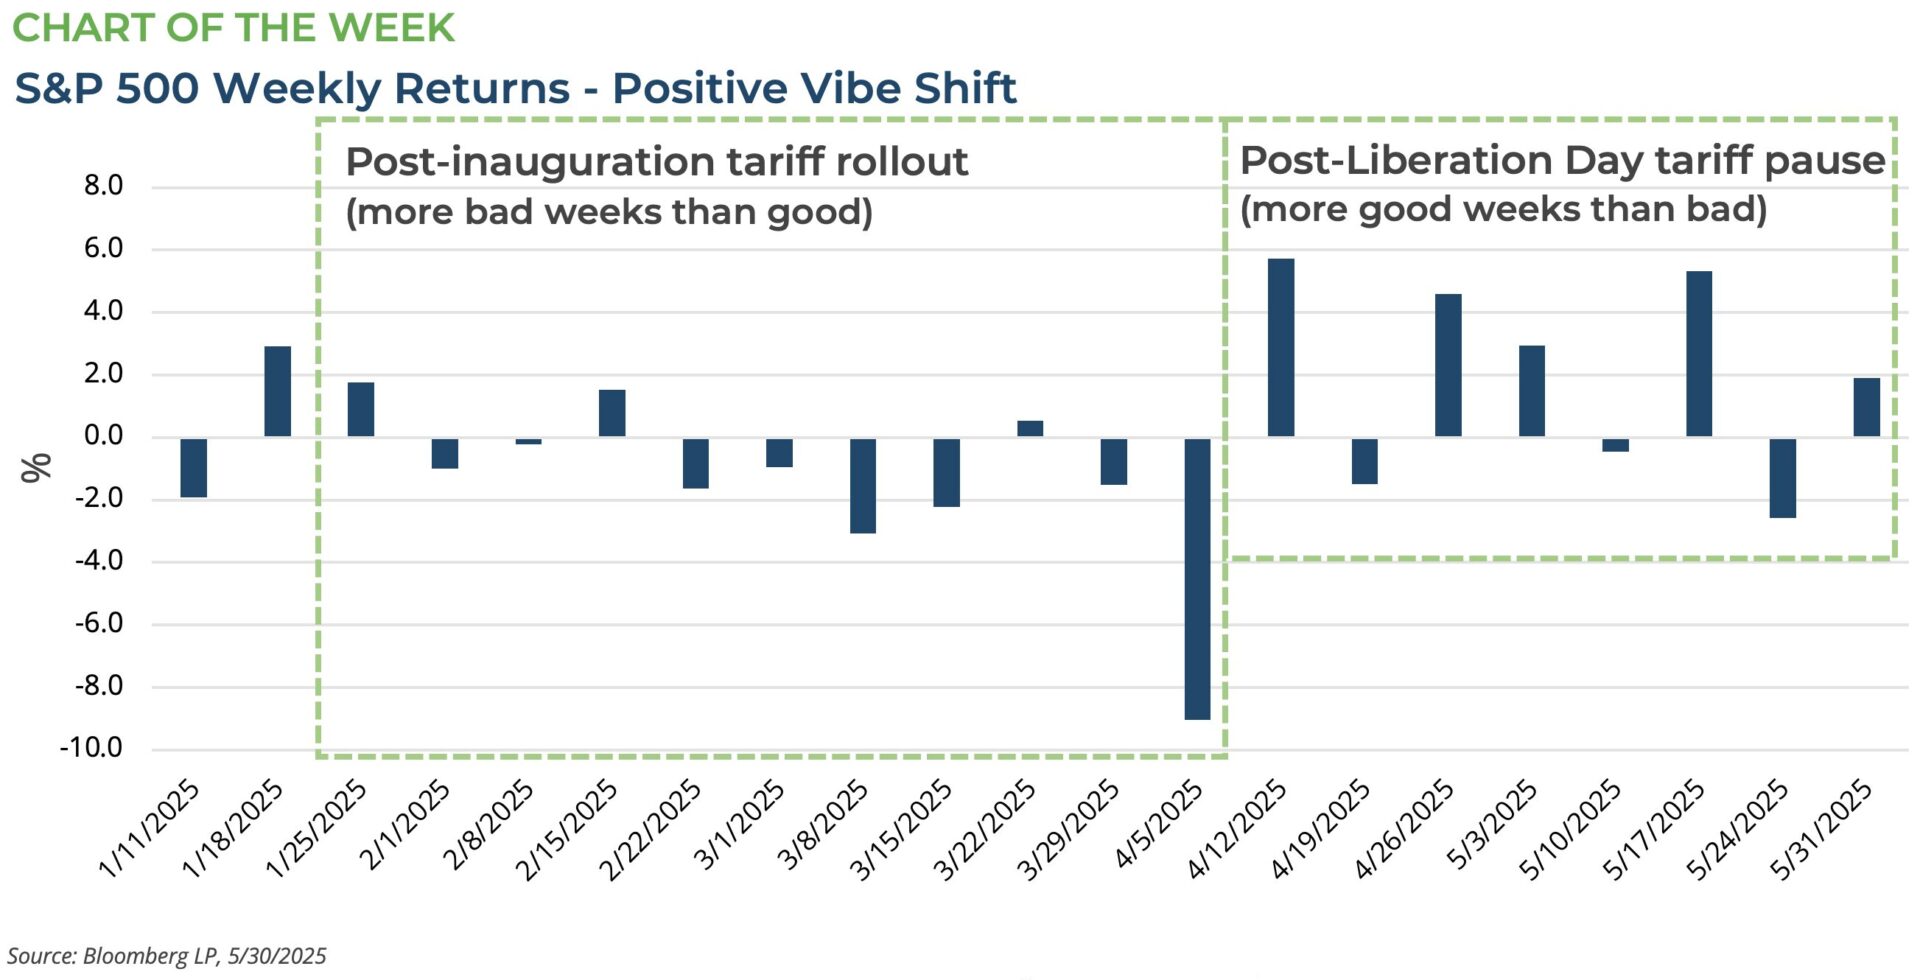
ONE MORE THOUGHT: May Markets Showcased a Risk-On, Positive Sentiment Rally
May saw a real shift in the mood within US markets. In early April, equity markets, in particular, were being buffeted by the substantial change in US tariff policy announced on 2-April (Liberation Day). However, about a week later the Trump administration pivoted and suspended most of its reciprocal tariffs that it had just announced for 90-days and signaled its intent to negotiate a series of bilateral trade deals. This sparked a rally in equity markets and shifted the narrative away from weeks of negative headlines related to tariffs and their negative impact on the economy. Sentiment was further boosted in May by the results from Q1 earnings season, which despite uncertainty over the direction of US trade policy were solidly ahead of expectations. Additionally in the first weeks of the month, the Trump administration announced the framework for a bilateral trade deal with the United Kingdom (UK) that gave hope to US equity markets that the worst-case scenarios associated with the reciprocal tariff policy could be avoided. Within days of the US-UK trade announcement, Trump also announced a de-escalation of the trade war with China with both countries dropping their tariff rates substantially for an interim period to give time for more bilateral trade talks to bear fruit on a permanent US-China trade deal. The last factor significantly boosting sentiment in May was the passage of a comprehensive tax bill from the House of Representatives that contained numerous measures that should provide incentives for both households and businesses to spend and invest in the coming years. The net result of this change in sentiment from February to early April’s depressed sentiment to late April and May’s positive sentiment was strong returns among a host of risk-assets. In May, the S&P 500 gained 6.3%, while mid-caps (Russell Midcap Index) gained 5.7%, and small caps (Russell 2000) gained 5.3%. Meanwhile, spreads tightened in high yield bonds and the Bloomberg Corporate High Yield Index gained 1.7% in May. Another way to see the stark shift is to look at weekly returns in the S&P 500—see Chart of the Week. In the eleven weeks following the inauguration, only three weeks had the S&P 500 making any gains as the Trump administration began to roll out its new tariff policy. However, after the 90-day reciprocal tariff pause was announced, the S&P 500 has five positive weeks and only three negative weeks. As we head into June, the S&P 500 looks expensive on a price-to-earnings basis, but so far earnings have remained strong, the economy resilient, and gauges of sentiment from households to businesses as well as market indicators of risk appetite have moved in a positive direction. Clearstead is advising our clients, that given the uncertainty and unknowns that loom this summer—Will tariffs go up or down from here? Will the tax bill pass Congress? Will the labor market remain strong?—to stay the course as it relates to their long-run asset allocations, and on the margin, favor things we can control. For instance, dividend paying stocks are less risky and speculative than companies relying on multiple expansion or lower interest rates to make further gains, and shorter duration fixed income with reasonable yields look attractive. Risk assets are likely to remain volatile this summer, but as the first five months of the year have shown, investors that do not panic and are focused on their long-run goals usually come out ahead.
[1] Bloomberg LP, 5/30/2025
[2] FactSet Earnings Insight 5/30/2025
DISCLOSURES: Information provided in this article is general in nature, is provided for informational purposes only, and should not be construed as investment advice. These materials do not constitute an offer or recommendation to buy or sell securities. The views expressed by the author are based upon the data available at the time the article was written. Any such views are subject to change at any time based on market or other conditions. Clearstead disclaims any liability for any direct or incidental loss incurred by applying any of the information in this article. All investment decisions must be evaluated as to whether it is consistent with your investment objectives, risk tolerance, and financial situation. You should consult with an investment professional before making any investment decision. Performance data shown represents past performance. Past performance is not an indicator of future results. Current performance data may be lower or higher than the performance data presented. Performance data is represented by indices, which cannot be invested in directly.
Related or Tagged New Posts

market perspectives
March 16th 2026
Research Corner | 3/16/2026
market perspectives
March 9th 2026
Research Corner | 3/9/2026

market perspectives
March 2nd 2026
Impact of Escalating Conflict in Iran
market perspectives
March 2nd 2026
Research Corner | 3/2/2026
market perspectives
February 23rd 2026
Research Corner | 2/23/2026
market perspectives
February 16th 2026
Research Corner | 2/16/2026

market perspectives
February 12th 2026
Market Update | US Dollar Debasement
market perspectives
February 9th 2026
Research Corner | 2/9/2026
market perspectives
February 2nd 2026
Research Corner | 2/2/2026
market perspectives
January 26th 2026
Research Corner | 1/26/2026
market perspectives
January 20th 2026
Research Corner | 1/20/2026

market perspectives
January 12th 2026
Quarterly Market Insights | 4Q25