Research Corner | 8/11/2025

OBSERVATIONS
- Markets traded higher last week with the S&P 500 gaining 2.4% and small caps (Russell 2000) also gaining 2.4%, while the yield on the 10-year US Treasury moved up 6 basis points to end the week at 4.28%.[1]
- The Services PMI fell to 50.1 in July—any number below 50 denotes contracting activity—down from June’s 50.8 reading almost matching the decline in the Manufacturing PMI which fell in July to 48.0 down from June’s 49.0 reading. Both the Services and Manufacturing PMIs came in below expectations and the subcomponent addressing hiring expectations fell in both the manufacturing and service sectors. Additionally, the prices-paid component—a gauge of inflationary pressures—increased for the service sector to 69.9, which was the highest reading since October-2022 (70.7).[1]
- Unemployment claims remain low with initial new claims climbing to 226k new claims, which was a 7k increase from the week prior. However, compared to last year there were 10k fewer claims last week compared to the same week in 2024.[1]
- The initial estimates for non-farm productivity in Q2 beat expectations and increased to 2.4% (annualized rate)—a large improvement from Q1’s 1.8% productivity decline. Taken together, productivity in the non-agricultural economy averaged about 0.3% in H1-2025, which is below the long-run average of about 2.0%.[1]
EXPECTATIONS
- The Trump administration raised the tariffs on imports from India last week to 50%—25% base line tariff + 25% tariff due to their importation of Russian oil—which suggests the Trump administration is willing to increase the economic pressure on Russia to begin earnest negotiations on a ceasefire in Ukraine.[1]
- The Bank of England (BoE) cut its main policy rated by 25 basis points last week to 4.0% in a contentious 5-to-4 vote. The BoE finds itself contending with sluggish growth and stubborn inflationary pressures.[1]
- The Trump administration nominated Stephen Miran, currently the head of the President’s Council of Economic Advisors, to fill out the term of Fed Governor Adriana Kugler who resigned earlier in the month. Miran, who has been a critic of Fed policy under current Fed Chairman Powell and favors a Fed more responsive to Executive direction, will only serve until January when Kugler’s term would have ended and his Senate confirmation is unlikely to occur before the next Fed voting meeting in mid-September.[1]
- About 90% of the S&P 500 have reported and, thus far, 81% of companies have issued a positive earnings surprise, which is above the 5-year average (77%) and 10-year average (75%). The blended earnings growth for Q2 is currently 11.8% year-over-year.[2]
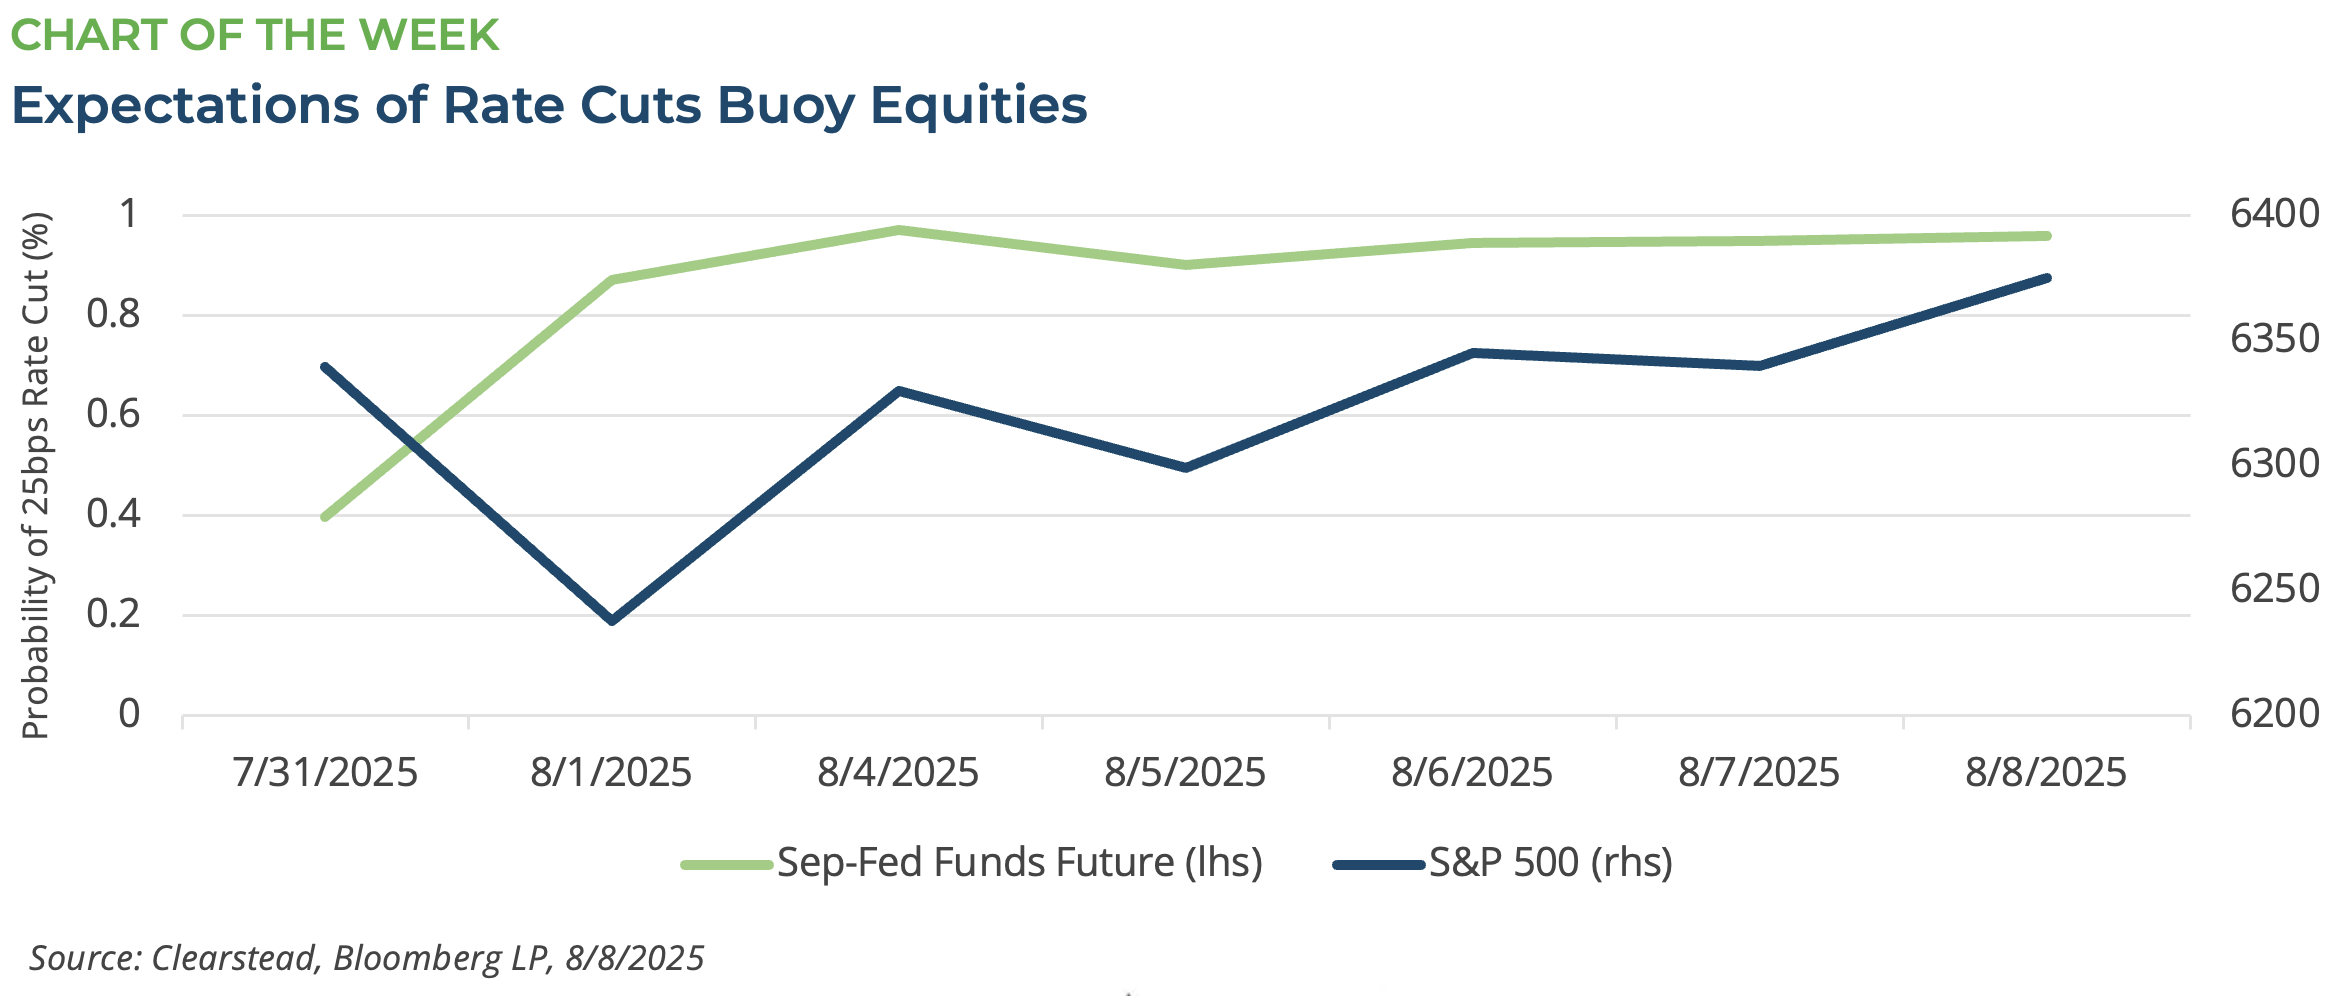
ONE MORE THOUGHT: Markets rebound, in part, on anticipation of Fed action in September[1]
Equity markets have been grappling with some weaker economic data points recently. On August 1st, the most recent job creation numbers were below expectations, but, perhaps, more worrying were the negative revisions to job numbers from May and June which were revised down to less than 20k new jobs apiece—see RC 4-Aug. Soon after the weak July jobs report came survey data from US purchasing managers—see Observations above—that suggested hiring was unlikely to pick-up and activity in both the US service and manufacturing sectors was weakening. After the July jobs report, the S&P 500 sold off about 1.6% and US small cap stocks (Russell 2000) fell by 2.0%. The VIX Index—the so called fear gauge—spiked from 3-points below its long run average to 3-points above it. However, the weaker than expected macro data has also shifted market perceptions around the course of Fed action. In the aftermath of the Fed’s late-July meeting in which they held rates steady and stressed their desire to be patient and see how the US’s evolving tariff policy impacted the economy, markets had only priced in about a 40% probability that the Fed would lower rates in September. At present, the markets have priced nearly a 96% probability that the Fed will cut rates at least 25 basis points in September. This anticipated shift in US monetary policy helped US stocks recover after the early August decline—see Chart of the Week. Since market expectations for easier US monetary policy increased, the S&P 500 has recovered all its early August losses and is once again trading near record highs. Small cap stocks have also recovered in a similar fashion. Similarly, the VIX sank below its long-run average of 19 and once again traded below 17—where it was for most of July. Now there are other factors at work as well which are helping equity markets in August. Foremost of these is the continued strength of S&P 500 Q2 earnings and the fact that many of these firms are indicating a more positive outlook for the back half of the year. Additionally, other measures of investor bullishness—put-call ratio, Bitcoin price, and Bull-Bear survey—all suggest that July’s positive investor sentiment has carried over into August. As we noted earlier in the month, this level of investor complacency coupled with an uncertain macro-outlook likely sets the stage for a choppy trading environment and most likely greater volatility in the weeks to come. However, patience is a virtue and there may be advantageous opportunities to put money to work as Q3 progresses.

[1] Bloomberg LP, 8/8/2025
[2] FactSet Earnings Insight 8/8/2025
Information provided in this article is general in nature, is provided for informational purposes only, and should not be construed as investment advice. These materials do not constitute an offer or recommendation to buy or sell securities. The views expressed by the author are based upon the data available at the time the article was written. Any such views are subject to change at any time based on market or other conditions. Clearstead disclaims any liability for any direct or incidental loss incurred by applying any of the information in this article. All investment decisions must be evaluated as to whether it is consistent with your investment objectives, risk tolerance, and financial situation. You should consult with an investment professional before making any investment decision. Performance data shown represents past performance. Past performance is not an indicator of future results. Current performance data may be lower or higher than the performance data presented. Performance data is represented by indices, which cannot be invested in directly.
Related or Tagged New Posts

market perspectives
April 8th 2026
Quarterly Market Insights | 1Q26 Quarterly
market perspectives
April 6th 2026
Research Corner | 4/6/2026
market perspectives
March 30th 2026
Research Corner | 3/30/2026
market perspectives
March 23rd 2026
Research Corner | 3/23/2026
market perspectives
March 16th 2026
Research Corner | 3/16/2026
market perspectives
March 9th 2026
Research Corner | 3/9/2026

market perspectives
March 2nd 2026
Impact of Escalating Conflict in Iran
market perspectives
March 2nd 2026
Research Corner | 3/2/2026
market perspectives
February 23rd 2026
Research Corner | 2/23/2026
market perspectives
February 16th 2026
Research Corner | 2/16/2026

market perspectives
February 12th 2026
Market Update | US Dollar Debasement
market perspectives
February 9th 2026
Research Corner | 2/9/2026