OBSERVATIONS
- Markets traded higher last week with the S&P 500 gaining 1.0% and hitting a new record high on Thursday, while small caps (Russell 2000) gained 3.1% and the yield on the 10-year US Treasury moved up 4 basis points to end the week at 4.32%.[1]
- Small business optimism increased in July with the NFIB index rising to 100.3, the highest level since February 2025 and above the long-term average of 98.0. Increases were seen in six of the index’s ten components, boosted by the passage of the One Big Beautiful Bill and tariff pauses.[1]
- Core inflation (CPI excluding food and energy) rose to 3.1% year-over-year (YoY), higher than expectations of 3.0% YoY. On a month-over-month (MoM) basis core CPI rose 0.3%, the largest MoM increase in 2025 and higher than the previous month’s 0.2% increase.[1]
- Producer prices (Producer Prices Index – PPI) rose 0.9% MoM in July, the biggest monthly jump in three years and much higher than expectations of 0.2%. PPI rose to 3.3% on a YoY basis, higher than expectations of 2.5%. The PPI index was higher than expected even after removing more food, energy, and trade.[1]
- Jobless claims remained subdued at 224k as compared to expectations of 225k. The 4-week moving average sits at 222k, hovering near a four-month low.[1]
- US retail sales rose 0.5% in July on a MoM basis, slightly less than expectations of 0.6%. Excluding auto and gas, retail sales rose 0.2% MoM compared to expectations of 0.3%. The so-called control group, which is a key input to GDP, rose 0.5% — better than expectations of 0.4%.[1]
- Consumer sentiment (University of Michigan Sentiment Index) fell to 58.6 (expectations were 62.0), driven by declines in the current conditions component and rising 1-Year inflation expectations.[1]
EXPECTATIONS
- The Federal Reserve’s Jackson Hole Economic Policy Symposium is set for this week under the theme of “Labor Markets in Transition: Demographics, Productivity, and Macroeconomic Policy.” Current Fed Chair Powell is set to speak on Friday in what is likely his final Jackson Hole speech, while markets will be looking for signals of policy shifts from the central bank.[2]
- China’s economy slowed across multiple metrics, driven by tariff related impacts—factory activity, retail sales, fixed-asset investment, and urban unemployment all disappointing relative to expectations.[1]
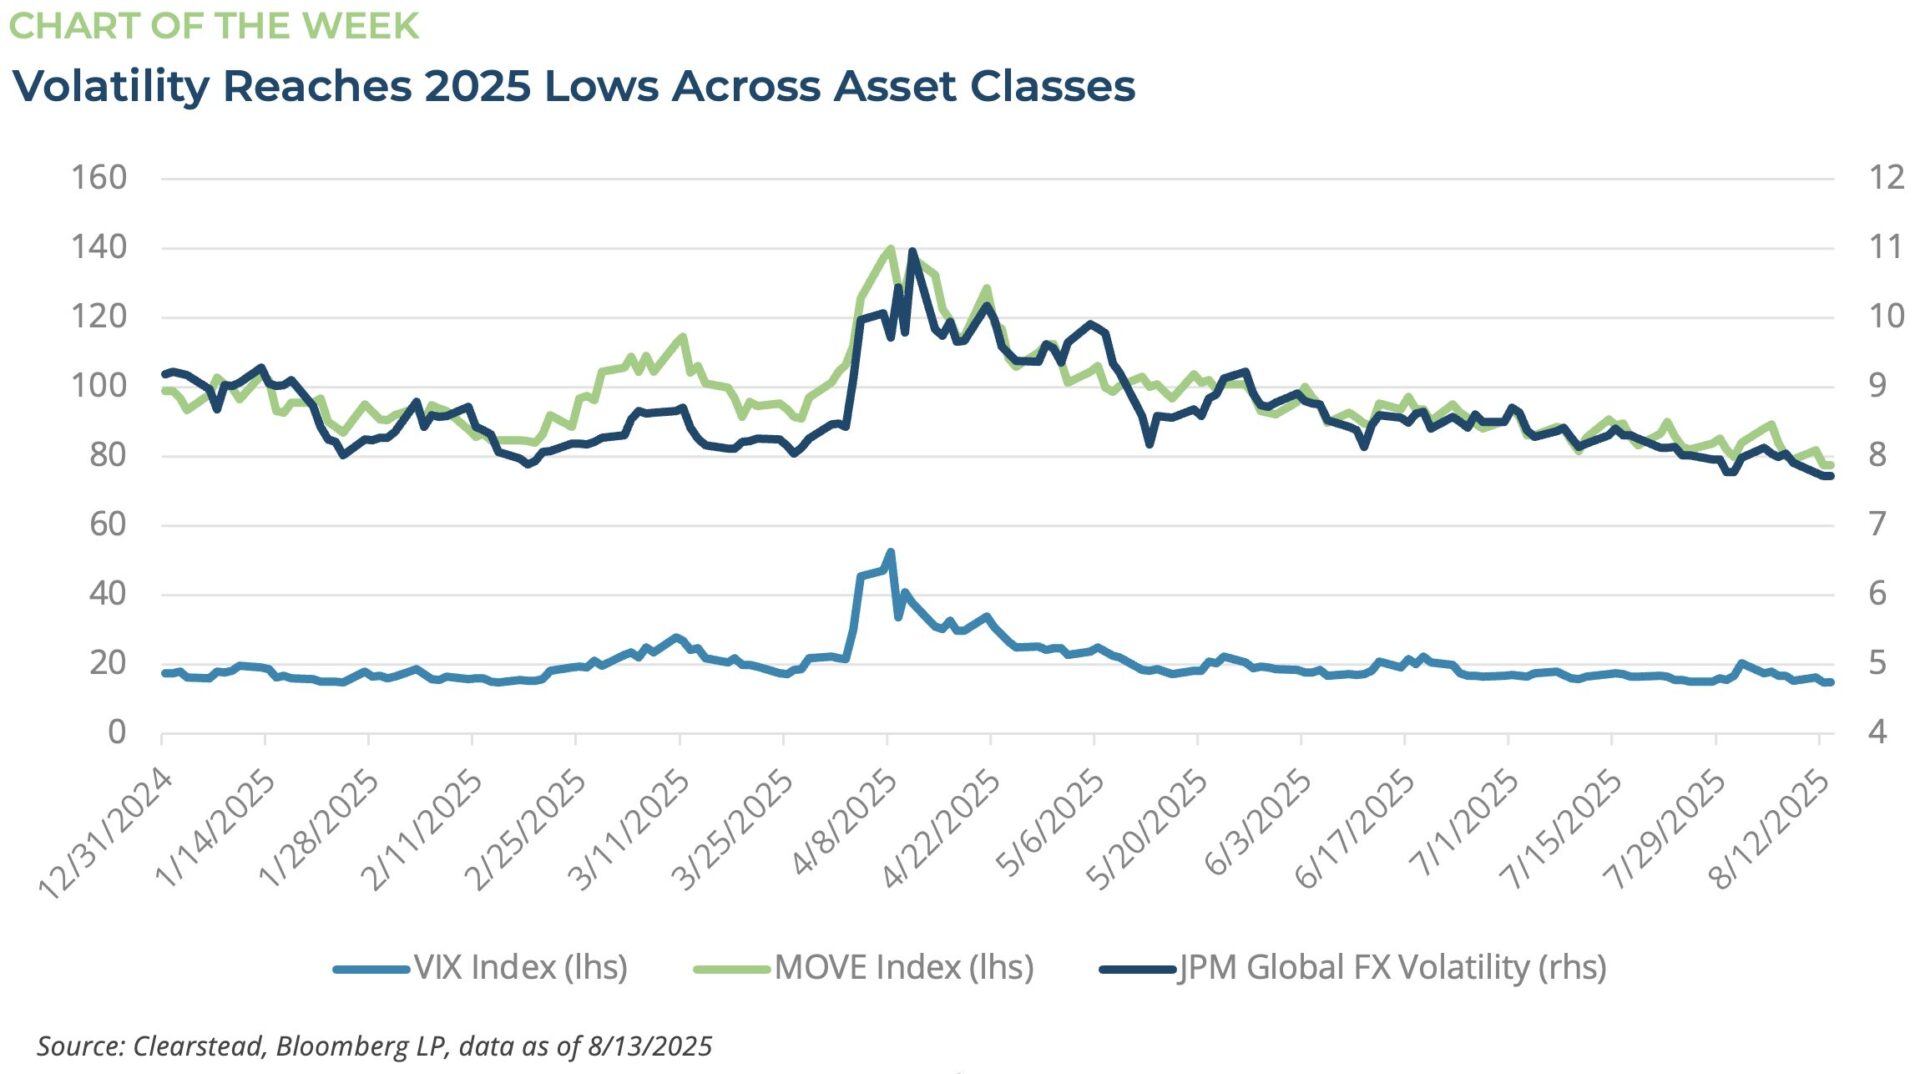
ONE MORE THOUGHT: Markets have calmed across asset classes amid a looming Fed Rate cut[3]
Major asset classes continue to enjoy continued positive momentum in August. Last week, the S&P 500 (VIX Index), bond market (MOVE Index), and foreign currencies (JPM Global FX Volatility) saw their respective volatilities reach the lows of 2025 (Chart of the Week). Despite last week’s uptick in consumer and wholesale inflation, markets took the data as evidence of enough benign inflation trends—coupled with recent downward revisions to employment data—and as a result interest rate cuts are now clearly embedded in market expectations. Interest rate markets are now pricing in a 90+% chance of a 25bps rate cut in September and a 60% chance for an additional 25bps rate cut in October. Last week, US Treasury Secretary Bessent argued for a 50bps rate cut in September followed by a series of cuts to drive the Fed Funds rate lower by 150 to 175bps. As we noted in our July 28 RC, the Fed is facing pressure with evidence mounting that a policy change is likely needed. We have also noted that the underlying inflation trends in survey data continue to point to some upward pressure on prices. That said, it is important to note that within the CPI data nearly one-third of prices that feed into the inflation statistics are now imputed, so-called alternate estimations (imputed data had ranged from 5-10% of the CPI in recent years). How accurate these measures are of true inflation is being called into question. Another important point/question from prognosticators is why the need to cut rates with markets at all-time highs? The narrative that the Fed only cuts rates when markets are falling or in trouble is not an accurate assessment. Since 1971, the Fed has cut rates 45 times across a range of macroeconomic regimes while the S&P 500 was at or near an all-time high (i.e., within 5% of an all-time high). Additionally, in the subsequent 12 months from these interest rate cuts the S&P 500 index rose in 90% of those observations by an average of over 10%. It is important to note that there is indeed a precedent and given the continued pressure and evolution of data (regardless of the noise), a rate cut cycle may well be in the cards – and markets are discounting this probability.
[1] Bloomberg LP, 8/8/2025
[2] https://www.kansascityfed.org/research/jackson-hole-economic-symposium/
[3] Bloomberg LP, https://www.apolloacademy.com/the-quality-of-the-cpi-data-continues-to-deteriorate/
Information provided in this article is general in nature, is provided for informational purposes only, and should not be construed as investment advice. These materials do not constitute an offer or recommendation to buy or sell securities. The views expressed by the author are based upon the data available at the time the article was written. Any such views are subject to change at any time based on market or other conditions. Clearstead disclaims any liability for any direct or incidental loss incurred by applying any of the information in this article. All investment decisions must be evaluated as to whether it is consistent with your investment objectives, risk tolerance, and financial situation. You should consult with an investment professional before making any investment decision. Performance data shown represents past performance. Past performance is not an indicator of future results. Current performance data may be lower or higher than the performance data presented. Performance data is represented by indices, which cannot be invested in directly.
Related or Tagged New Posts

market perspectives
March 16th 2026
Research Corner | 3/16/2026
market perspectives
March 9th 2026
Research Corner | 3/9/2026

market perspectives
March 2nd 2026
Impact of Escalating Conflict in Iran
market perspectives
March 2nd 2026
Research Corner | 3/2/2026
market perspectives
February 23rd 2026
Research Corner | 2/23/2026
market perspectives
February 16th 2026
Research Corner | 2/16/2026

market perspectives
February 12th 2026
Market Update | US Dollar Debasement
market perspectives
February 9th 2026
Research Corner | 2/9/2026
market perspectives
February 2nd 2026
Research Corner | 2/2/2026
market perspectives
January 26th 2026
Research Corner | 1/26/2026
market perspectives
January 20th 2026
Research Corner | 1/20/2026

market perspectives
January 12th 2026
Quarterly Market Insights | 4Q25