OVERVIEW
September has historically been a volatile month that has produced negative returns about 50% of the time. [1] But not this year. In September alone, the S&P 500 hit eight separate record highs. Similarly, measures of investor sentiment have shown lots of positivity. The weekly Bull-Bear survey was above its 5-year average for most of the month, suggesting many retail investors have a positive outlook on stocks. Other measures, such as the VIX—the so-called fear gauge—remained below its long-run average throughout September. Another measure of investor risk appetite can be seen in the low spreads in investment-grade corporate bonds—Bloomberg Investment Grade Corporate Bond Index shows the difference in the yield between a treasury and investment grade corporate bond of the same maturity—which hit a 27-year low in September.[1]
On the economic front, job creation appears to have stalled, despite little evidence of layoffs. While inflation remains sticky as the Fed’s preferred inflation measure, the PCE Core Price Index increased to 2.9% YoY in July, which was higher than June’s 2.8% YoY figure.[1] Citing the weakness in the labor market, the Federal Reserve cut its main policy rates by 25 basis points to between 4.0% and 4.25%. While Fed action in the final months is not fully clear, monetary policy is likely to become incrementally less restrictive as we close out 2025 and head into 2026.
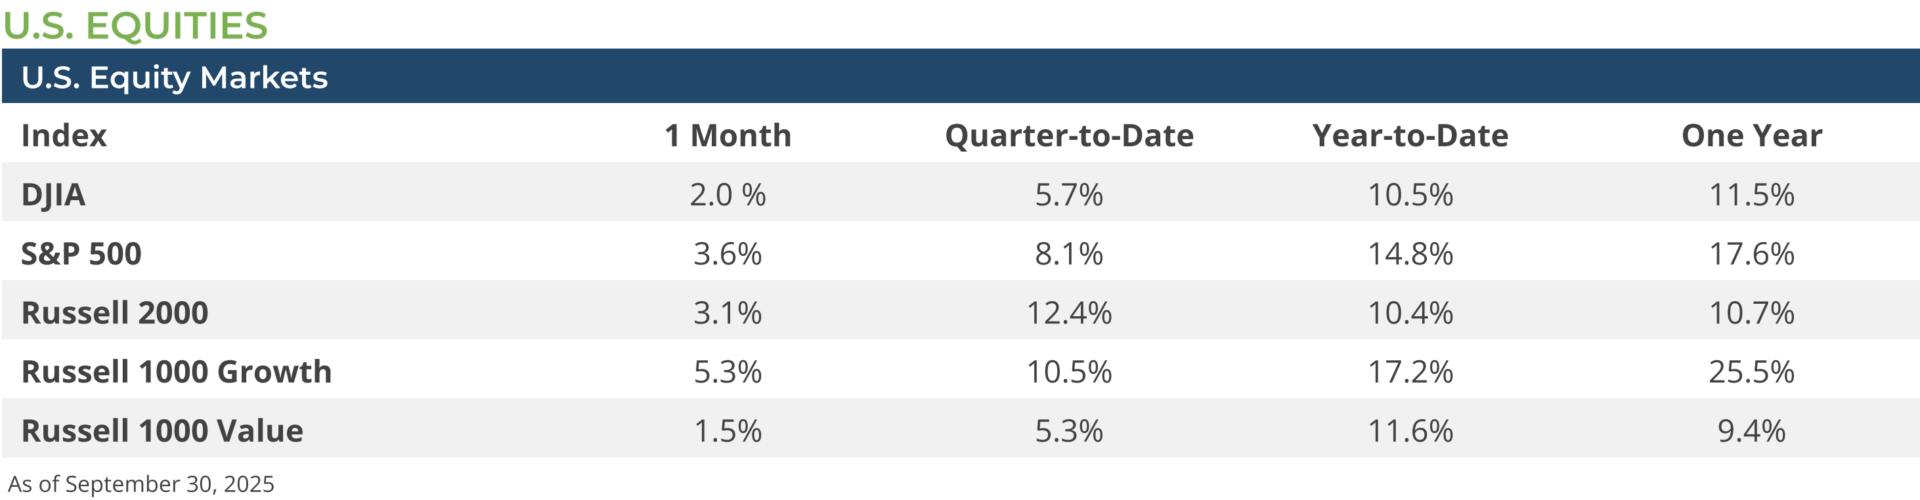
US equities had a good month, led by Magnificent 7 stocks (Mag-7)—Alphabet, Amazon, Apple Meta, Microsoft, NVIDIA, and Tesla—which gained almost 9.0% for the month. Meanwhile the S&P 500 gained 3.6% and small caps (Russell 2000 Index) gained 3.1% and mid-cap stocks (Russell Midcap Index) lagged behind with a 0.9% gain in September. Given the performance of the Mag-7 stocks, it should be no surprise that more growth-oriented stocks outperformed their value peers—Russell 1000 Growth Index +5.3% vs. Russell 1000 Value Index +1.5%)—during the month.
At a sector level, Communication Services (+5.6%) and Technology (+7.2%) led the way in September, while several other sectors registered gains, but the Energy (-0.4%), Consumer Staples (-1.6%), and Materials (-2.1%) sectors faced declines as investors heavily favored a small number of mega-cap stocks.
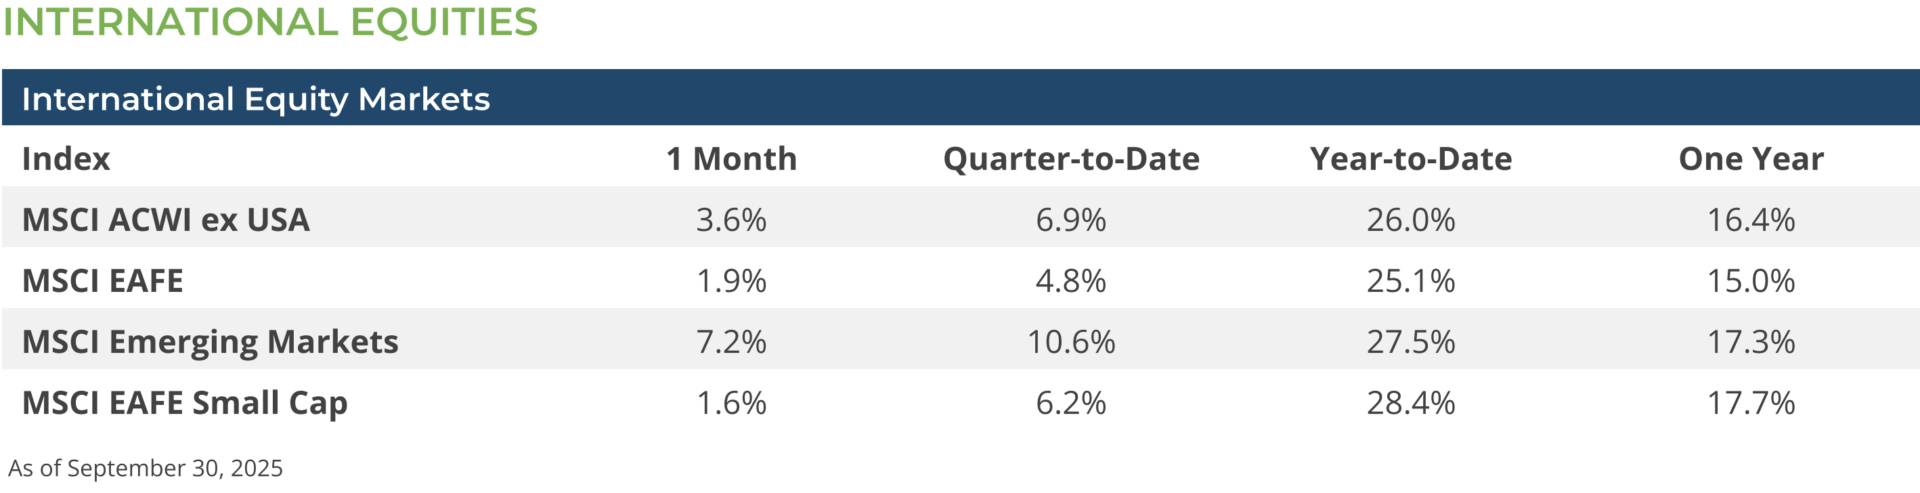
Non-US equities markets also had a positive September and were led by Chinese equities. The MSCI China Index gained 9.8% during the month as the Chinese government’s attempt to curb price wars began to bear fruit and industrial profits began to recovery. The strong performance by Chinese equities also buoyed the wider world of emerging market equities the MSCI EM Index gained 7.2% in October. Whereas International developed equities gained only 1.9% as many European shares were flat during the month. Similar to the US, international growth stocks outperformed their value peers—MSCI ACWI ex US Growth Index +4.1% vs MSCI ACWI ex US Value Index +3.0%—and small caps lagged their large cap peers—MSCI ACWI ex US Index +3.6% vs. MSCI ACWI ex US Small Index +2.1%. The US dollar was largely stable against a broad basket of foreign currencies in October and had a negligible impact on the returns of foreign equities for US investors.
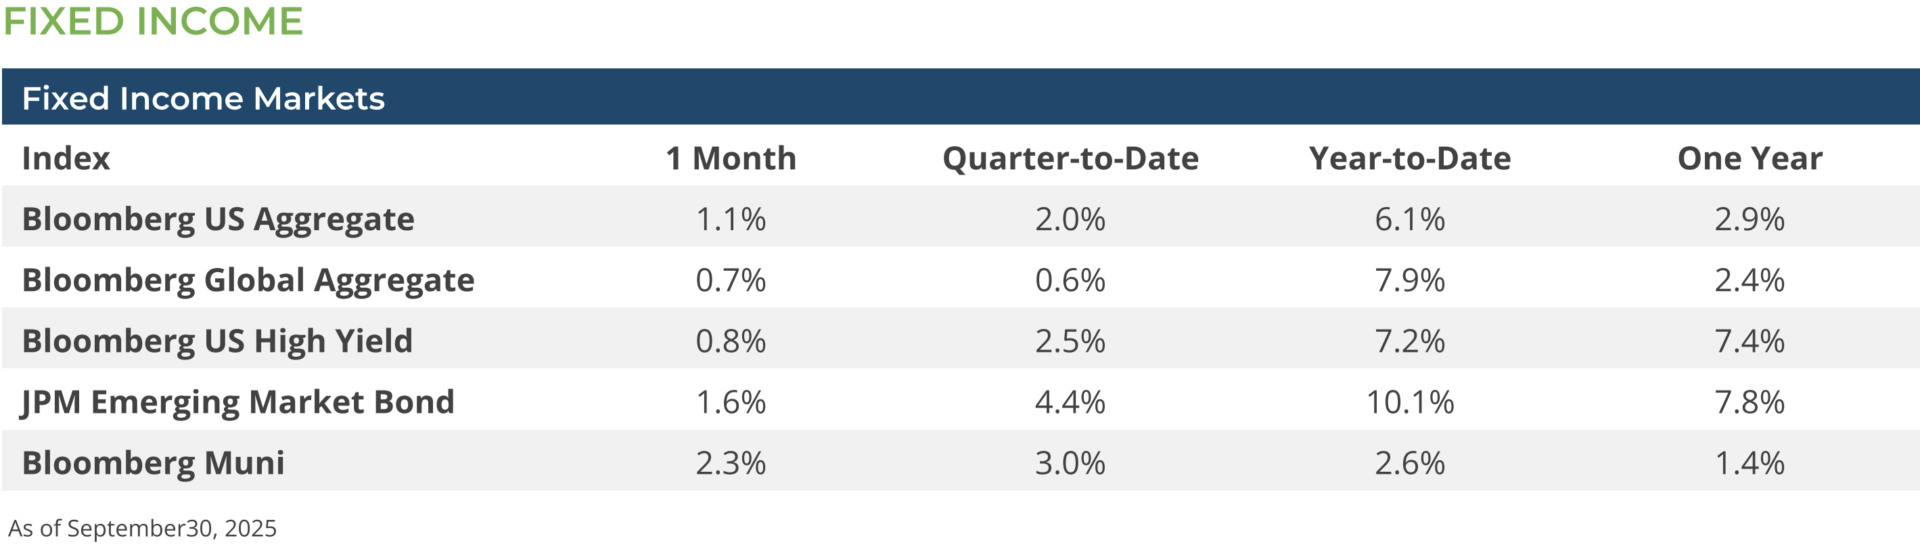
Lower long-term interest rates (U.S. Treasury 30-year bonds declined 20 basis points from 4.93% to 4.73%[1] helped the Bloomberg Aggregate Index to post a 1.09% return for the month, while the combination of lower rates and stable spreads allowed the high yield market to deliver a return of 0.82% (Bloomberg U.S. Corporate High Yield Index).
Although long-term rates declined significantly, 2-year U.S. Treasury yields were essentially unchanged on a monthly basis. As such returns at the short end of the curve (1-3 years), although producing a positive return of 0.33%[1] (Bloomberg U.S. Aggregate 1-3 Years index), had a difficult time competing with the 3.07% return of the Bloomberg U.S. Aggregate 10+ Index. Curve positioning has become a differentiator in month-to-month performance as the bond market grapples with weak employment versus inflation stuck at mildly higher levels.
Munis rallied and outperformed taxable fixed income (Bloomberg Municipal Bond Index 2.32%). Technicals improved as supply slowed amid persistent demand.
CONCLUSION & OUTLOOK
Given the multitude of reasons for markets to decline – weak employment, stubbornly high inflation, tariffs, political unrest internationally, and a government shutdown domestically – one would expect the financial markets at best to be cautious and at worst to be running for cover. Instead, equity investors appear to focus on strong corporate earnings while fixed income investors are comfortable buying bonds at tight spreads given that the absolute level of rates are levels not seen in the last decade. We have been pleasantly surprised by the strong up-draft in U.S. financial markets over the past several weeks, and we are also generally optimistic about the prospects for markets in 2026. Nonetheless, we would not be surprised if some volatility creeps back into the markets in the coming weeks.
Subscribe to our weekly Research Corner and other market commentary so you don’t miss our updates.
[1] Bloomberg LP 9/30/2025
DISCLOSURES: Information provided in this article is general in nature, is provided for informational purposes only, and should not be construed as investment advice. The views expressed by the author are based upon the data available at the time the article was written. Any such views are subject to change at any time based on market or other conditions. Clearstead disclaims any liability for any direct or incidental loss incurred by applying any of the information in this article. All investment decisions must be evaluated as to whether it is consistent with your investment objectives, risk tolerance, and financial situation. The performance data shown represent past performance. Past performance is not an indicator of future results. Current performance data may be lower or higher than the performance data presented.
Related or Tagged New Posts

market perspectives
April 1st 2026
March Review 2026
market perspectives
March 2nd 2026
February Review 2026

market perspectives
February 17th 2026
Beyond the Agg
market perspectives
February 2nd 2026
January Review 2026
market perspectives
January 6th 2026
December Review 2025
market perspectives
December 1st 2025
November Review 2025

market perspectives
December 1st 2025
Market Update | Private Credit
market perspectives
November 3rd 2025
October Review 2025
market perspectives
September 2nd 2025
August Review 2025
market perspectives
August 1st 2025
July Review 2025
market perspectives
July 1st 2025
June Review 2025
market perspectives
June 2nd 2025
May Review 2025