
OVERVIEW
In last month’s Market Minute, we discussed the US–Iran conflict and said, “The outcome of the conflict is bimodal: peace/de-escalation should be a boost for markets, while escalation/long-term conflict would be a catalyst for increased volatility, most likely resulting in markets being materially down.” Well, a shaky ceasefire between the US and Iran is holding, but the Strait of Hormuz remains closed, leaving the conflict not yet resolved but also not escalating. Nonetheless, investors appear to either not care or are simply assuming peace is imminent, as they resumed their habit of “buying the dip” and driving equity prices ever higher.
Without the Iran crisis, the markets were well supported by stable economic data and strong corporate fundamentals. Although job gains have remained low, the unemployment rate has changed little in recent months. The US March unemployment rate declined to 4.3%[1], providing the confidence the consumer needs to keep on shopping (US retail sales rose stronger than expected in both February and March). Adding to investor optimism has been a strong beginning to the corporate earnings reporting period. So far, about 63% of the S&P 500 have reported Q1 earnings, and 84% of companies are reporting a positive earnings surprise, which is better than the 5-year (78%) and the 10-year (76%) averages. Overall, Q1 earnings are on track to grow by 27.1% YoY[2]. All the positive news has prevailed over news surrounding the conflict with Iran and the accompanying rise in oil prices (up almost 13% in April alone[1]). Sometimes you just can’t keep a good market down.
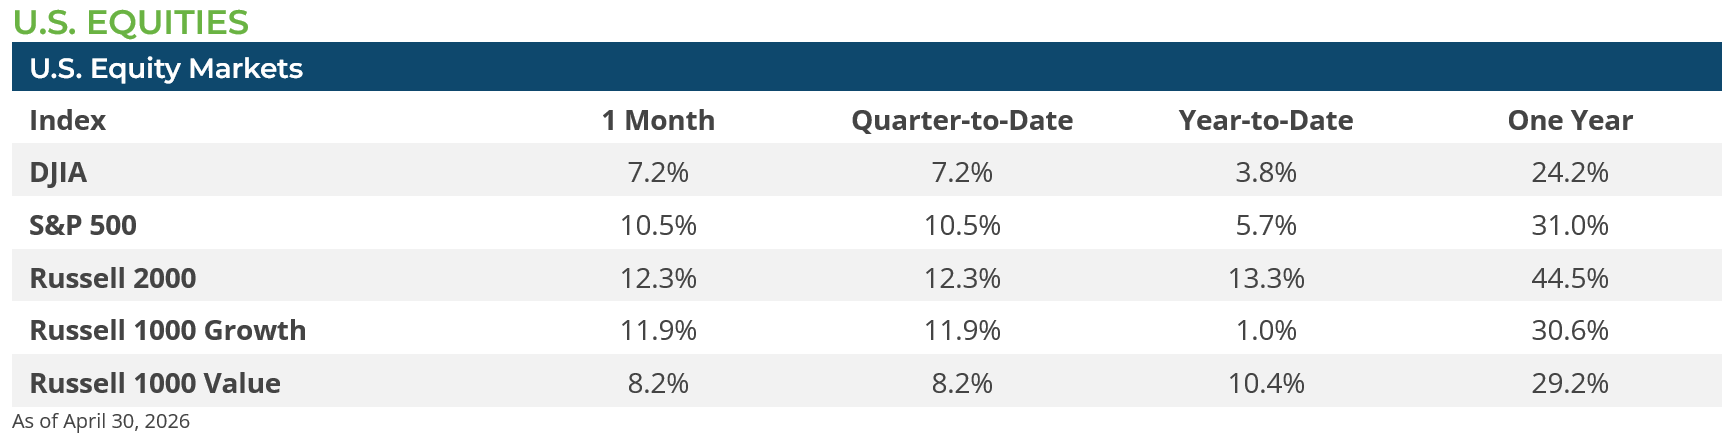
US stocks experienced an incredible month. The S&P 500 gained 10.5% for the month—in the past 80 years, the S&P has recorded a gain over 10% only 13 other times (less than 1.5% of monthly returns)—and hit several new record highs.[1] Record highs were also set by the NASDAQ and Russell 2000 (small caps) indices in April. The gains in the market were broad-based, with most sectors gaining ground in April except for Energy and Healthcare. Across the cap spectrum, gains were barbelled, with small caps (Russell 2000 Index) 12.X% and large caps (Russell 1000 Index) gaining 10.1%, but midcaps (Russell Midcap Index) gaining only 7.3%.
The change in investor sentiment was palpable in April. Once the US–Iran ceasefire took effect and began to hold, investors pivoted quickly to the strong earnings season and took comfort in the fact that the US economy is somewhat insulated from the energy crunch that is unfolding beyond its borders in Asia and Europe. During April, a variety of risk-on sentiment indicators—VIX, put-call ratio, etc.—moved from the below-average risk-off levels seen in March to above-average risk-on levels in April, particularly in the final weeks of the month.
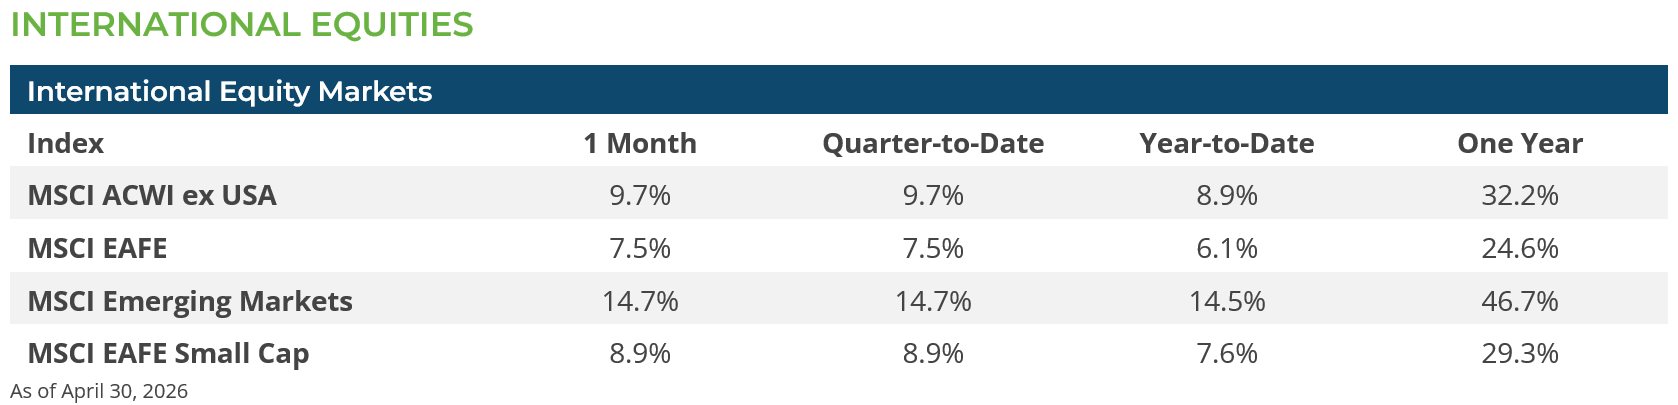
International equities also had a strong month, with international developed equities (MSCI EAFE Index) gaining 7.5% and emerging market equities (MSCI EM Index) gaining 14.7%. Emerging market gains were once again powered by AI-oriented technology companies in Korea (MSCI Korea Index +37.4%) and Taiwan (MSCI Taiwan Index +26.6%). In contrast, European and Japanese equities, which comprise much of the MSCI EAFE, had more muted gains—despite the US dollar weakening, which helps US$-based returns—due to concerns that energy shortages stemming from the Strait of Hormuz closure would dampen economic growth this year while simultaneously increase inflationary pressures that could require tighter monetary policy to counteract.
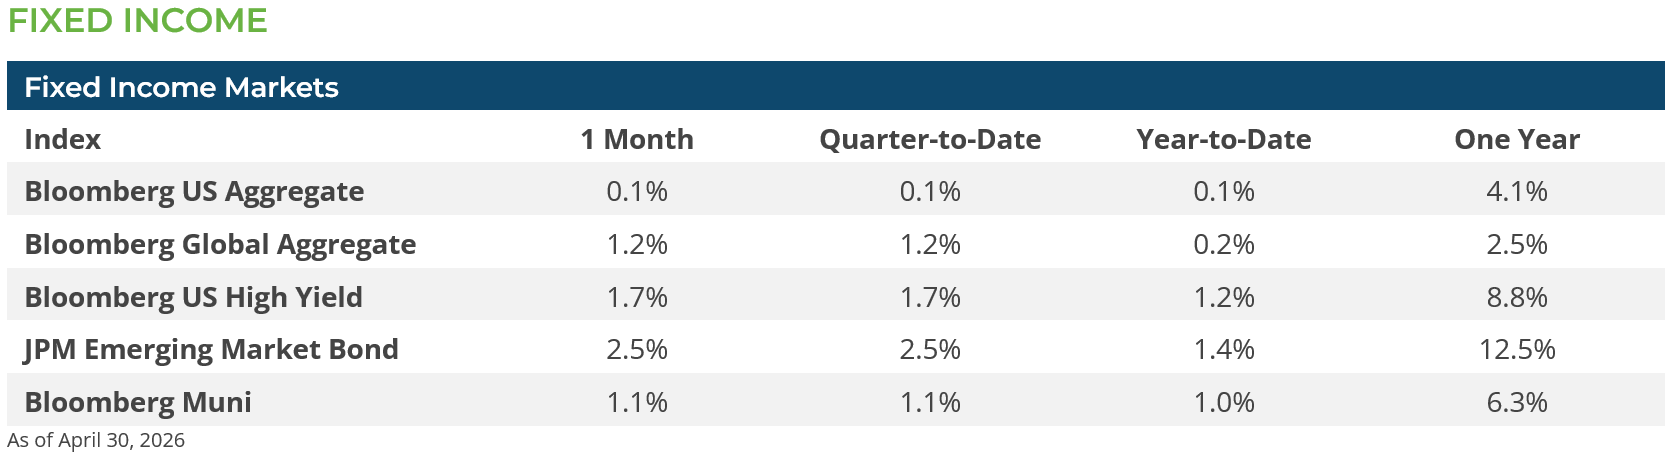
Much like the equity markets, April rewarded those who added risk to their fixed income portfolios. While interest rates drifted up, spreads on corporate and emerging market debt tightened. The Bloomberg US Corporate High Yield Index option-adjusted spread (OAS) was down 49 bps, and the JP Morgan Emerging Market Index OAS declined by 36 bps. As such, the JP Morgan Emerging Markets Bond Index returned an impressive 2.53%, and the Bloomberg US Corporate High Yield Index was up 1.69%, while the Bloomberg US Treasury index was down -0.07%. In an environment driven primarily by the U.S.–Iran conflict, macro-driven volatility is pushing Treasury rates around more aggressively, while muni technicals remain relatively stable. Even as volatility persists, municipals continue to demonstrate resilience, particularly in intermediate maturities, where demand remains steady. April’s solid return of 1.15% for the Bloomberg Municipal Bond Index follows a disastrous March performance of -2.32%.
CONCLUSION & OUTLOOK
The S&P 500’s monthly gain in excess of 10% is astounding, given the significant risks that confront a continuation of such market activity. Interest rates rose in April (10-year US Treasury yields increased from 4.32% to 4.37%[1]) due to rising concerns about inflation and the ever-increasing federal debt load (as of late April 2026, the total US federal debt is approximately $39 trillion[3]). The markets entered the year expecting three 25 basis point cuts in the Fed Funds rate, and the outlook now is for none, as the Fed appears comfortable at its present policy range (3.50% to 3.75%).
While headlines suggest that earnings revisions are strong overall, this obfuscates an important detail: only a small number of sectors and companies are driving the gains. Of the eleven equity sectors in the S&P 500, only four—Energy, Materials, Technology, and Communication Services—have seen material positive revisions this year. Four sectors have had their earnings estimates revised down since the year began and two sectors are largely unchanged.[2] A prolonged US–Iran conflict could lead to high inflation paired with stagnant growth and potentially triggering a global recession. Key impacts include sustained oil price spikes over $100/barrel, broken supply chains, severely reduced market confidence, and a Fed forced to keep interest rates high or even increase them to fight inflation. Although the markets appear to be undaunted by these risks, we should not be surprised by bouts of volatility as the conflict drags on.
Subscribe to our weekly Research Corner and other market commentary so you don’t miss our updates.
[1] Bloomberg LP
[2] Factset as of May 1, 2026
[3] https://fiscaldata.treasury.gov/americas-finance-guide/national-debt/
DISCLOSURES: Information provided in this article is general in nature, is provided for informational purposes only, and should not be construed as investment advice. The views expressed by the author are based upon the data available at the time the article was written. Any such views are subject to change at any time based on market or other conditions. Clearstead disclaims any liability for any direct or incidental loss incurred by applying any of the information in this article. All investment decisions must be evaluated as to whether it is consistent with your investment objectives, risk tolerance, and financial situation. The performance data shown represent past performance. Past performance is not an indicator of future results. Current performance data may be lower or higher than the performance data presented.
Related or Tagged New Posts

market perspectives
July 8th 2026
June Review 2026
market perspectives
June 1st 2026
May Review 2026
market perspectives
April 1st 2026
March Review 2026
market perspectives
March 2nd 2026
February Review 2026

market perspectives
February 17th 2026
Beyond the Agg
market perspectives
February 2nd 2026
January Review 2026
market perspectives
January 6th 2026
December Review 2025
market perspectives
December 1st 2025
November Review 2025

market perspectives
December 1st 2025
Market Update | Private Credit
market perspectives
November 3rd 2025
October Review 2025

market perspectives
October 1st 2025
September Review 2025
market perspectives
September 2nd 2025
August Review 2025