OBSERVATIONS
- Markets traded slightly higher even as near-term prospects dimmed for the Strait of Hormuz to reopen and oil prices rose. The S&P 500 gained 0.3%, while small caps (Russell 2000) gained 0.5% and the yield on the 10-year Treasury rose 7 basis points to end the week at 4.37%.[1]
- The S&P CoreLogic Case-Shiller National Home Price Index rose 0.7% year-over-year (YoY) in February 2026 (latest available), down from 0.8% YoY the prior month and the slowest pace in years for housing prices.[1]
- Housing starts were released for both February and March last week as the US Census continues to catch up with its data releases. Housing starts in February declined to 1.356 million (annualized rate) registering a 3% decline from January, but housing starts increased in March to 1.502 million, which was a month-over-month (MoM) increase of 10.8% and the highest rate for new housing starts since December-2024.[1]
- New orders for durable goods rebounded 0.8% MoM in March 2026, beating expectations and snapping three months of declines, led by gains in computers/electronics (AI-related) and transportation.[1]
- The PCE price index increased in March to 3.5% YoY from February’s 2.8% YoY figure. The Fed’s preferred inflation gauge core-PCE, which removes the volatile food and energy components, also rose in March hitting 3.2% YoY, up from February’s 3.0% YoY rate.[1]
- Initial unemployment claims remain low and fell last week by 26k from the week prior to 189k new claims, while compared to the same week last year, claims were over 44k fewer.[1]
- The initial estimate for real GDP came in below expectations at 2.0% (annualize rate) for Q1, however private domestic final sales—a reading of the private sector’s (consumers and business) demand—rose at a healthy 2.5% rate, but net exports detracted in Q1 and government spending came in softer than expected.[1]
- The ISM Manufacturing PMI was unchanged in March at 52.7—any figure >50 denotes expanding economic activity—but the prices paid component jumped to 84.6, which is the highest level since Apr-2022.[1]
EXPECTATIONS
- The Fed left interest rates unchanged last week and issued similar guidance in its formal statement which suggests that the Fed is biased towards future rate cuts. However, three Fed officials dissented from the policy statement (not the decision to hold rates) and Fed Chairman Powell, in his last Fed press conference, noted that Fed officials are generally “moving toward a more neutral” outlook for future policy moves.[1]
- Other central banks including the European Central Bank, Bank of England and the Bank of Japan all also held rates steady last week, but they all signaled a rate hike later this year as inflation pressures mounted.[1]
- About 63% of the S&P 500 have reported Q1 earnings, including six of the Mag7 stocks, and 84% of companies are reporting a positive earnings surprise, which is better than the 5-year (78%) and the 10-year (76%) average. Overall, Q1 earnings are on track to grow by 27.1% YoY.[2]
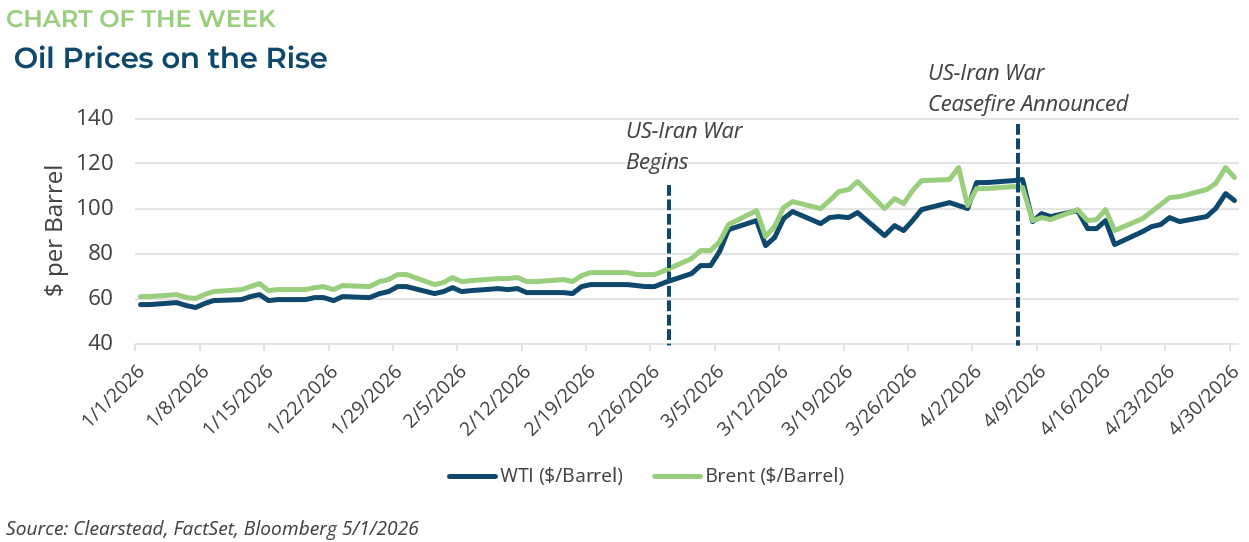
ONE MORE THOUGHT: US-Iran War Upending Oil Prices and OPEC[1]
The implications of the US-Iran War will continue even after the conflict reaches a more permanent resolution. At present the shaky ceasefire that began in late March continues to hold, but the Strait of Hormuz remains largely closed and the path to the normalization of shipping traffic through the strait does not seem apparent at present. As a result, the price of oil has moved higher over the past several days as traders begin to price in reduced global supplies for a longer period of time. The futures market expects the price of West Texas Intermediate crude to be above $75 a barrel and Brent crude to be above $85 per barrel through end of the year—both far above their price pre-conflict. The damage to refineries and LNG facilities in the region is also likely to take several months or even years to repair and bring production back on-line—Qatar’s Ras Laffan LNG complex could be partially offline for over 3-years. Despite the fact the conflict could re-escalate, many Gulf states are already beginning the process of repairing the damage to the oil and gas infrastructure. Additionally, many Gulf states are determining how they can re-route oil and gas production to permanently bypass the Strait of Hormuz, a process that will be both costly and time consuming. Lastly, the costs of reconstruction could reach as high as $58 billion dollars, many in the region are taking steps to re-allocate resources. For instance, the Saudi sovereign wealth fund has abandoned some of its investments, including the LIV Golf Tour, as it re-prioritizes spending on war related damage. In the aftermath of the conflict, the UAE has announced it will leave the OPEC group, in large part due to OPEC quotas that inhibited its oil production. The UAE was one of the hardest hit gulf states by Iran during the conflict and OPEC had restricted its output to less than 3.5 million barrels per day. The UAE announcement said it would focus on its national rebuilding interest and maximizing output which could be as high as 5 million barrels a day. While negotiations between the US and Iran may eventually restart and the Strait of Hormuz may fully re-open, the region (and global oil markets) will never be the same.

[1] Bloomberg LP, 5/1/2026
[2] FactSet Earnings Insight 5/1/2026
Information provided in this article is general in nature, is provided for informational purposes only, and should not be construed as investment advice. These materials do not constitute an offer or recommendation to buy or sell securities. The views expressed by the author are based upon the data available at the time the article was written. Any such views are subject to change at any time based on market or other conditions. Clearstead disclaims any liability for any direct or incidental loss incurred by applying any of the information in this article. All investment decisions must be evaluated as to whether it is consistent with your investment objectives, risk tolerance, and financial situation. You should consult with an investment professional before making any investment decision. Performance data shown represents past performance. Past performance is not an indicator of future results. Current performance data may be lower or higher than the performance data presented. Performance data is represented by indices, which cannot be invested in directly.
Related or Tagged New Posts

market perspectives
July 6th 2026
Research Corner | 7/6/2026
market perspectives
June 29th 2026
Research Corner | 6/29/2026
market perspectives
June 22nd 2026
Research Corner | 6/22/2026
market perspectives
June 15th 2026
Research Corner 6/15/2026
market perspectives
June 8th 2026
Research Corner 6/8/2026
market perspectives
June 1st 2026
Research Corner | 6/1/2026
market perspectives
May 26th 2026
Research Corner | 5/26/2026
market perspectives
May 18th 2026
Research Corner | 5/18/2026
market perspectives
May 11th 2026
Research Corner | 5/11/2026
market perspectives
April 27th 2026
Research Corner | 4/27/2026
market perspectives
April 20th 2026
Research Corner | 4/20/2026
market perspectives
April 13th 2026
Research Corner | 4/13/2026