OVERVIEW
The S&P 500 gained over 10% in April, marking one of the top monthly returns for the S&P 500 in 80 years, and the positive momentum continued into May.[1] Global equities were broadly higher in May, as the S&P 500 gained over 5.2% for the month, but the gains were largely concentrated in select areas of the market related to AI—particularly semiconductor and memory stocks. As we entered May, markets were unsure about the path of Fed action for the remainder of the year. For most of Q1, markets had expected the Fed to eventually cut rates in 2026. However, by the end of April, a combination of increased energy prices due to the U.S.-Iran war and stability in the U.S. employment picture caused the market to begin shifting its perspective. Early in the month, markets anticipated no Fed action on rates this year (neither cuts nor hikes). As we close out May, markets are now anticipating a nearly 60% chance that the Fed will be compelled to hike rates by the end of the year as inflationary pressures increase.
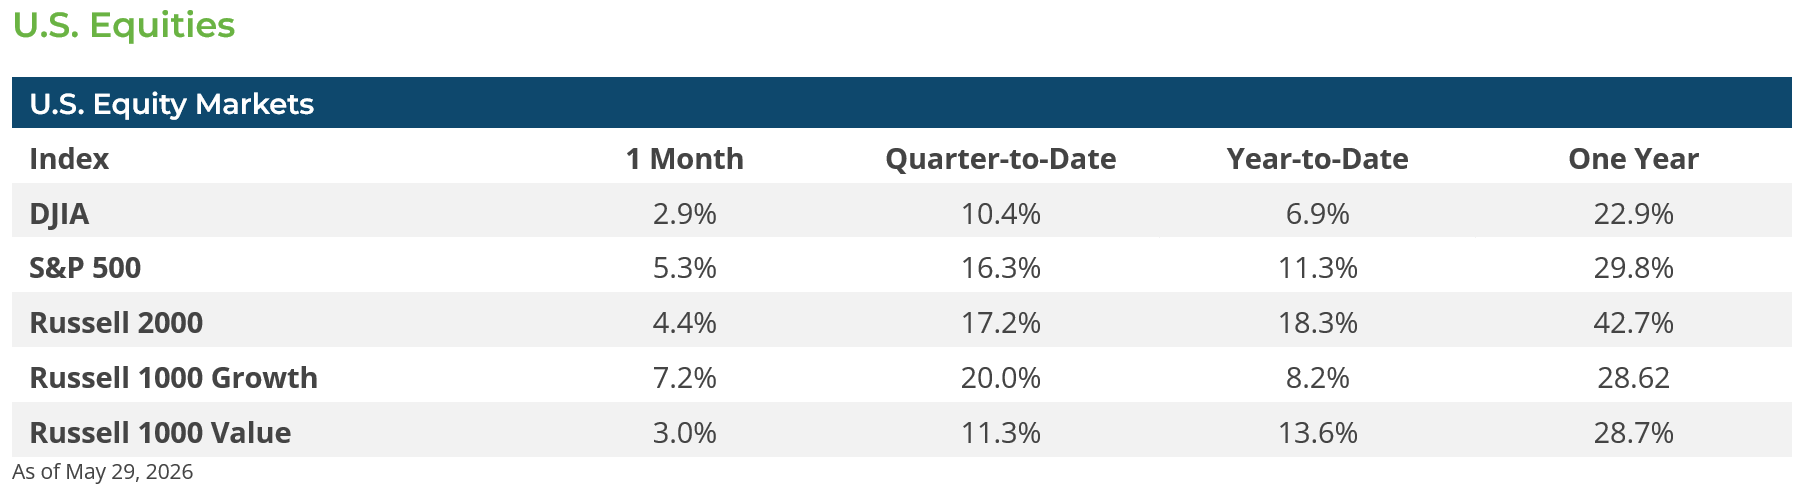
U.S. equities had another strong month of gains. In just 19 trading days in May, the S&P 500 hit 11 separate new record highs—basically one every other day—and gained over 5.2% for the month. However, the gains for May were largely concentrated among tech stocks, with semiconductor, memory, and AI stocks leading the way. Of the eleven sectors that comprise the S&P 500 index, eight (Consumer Staples, Energy, Financials, Industrials, Materials, Real Estate, Communication Services and Utilities) posted negative returns for the month. The Consumer Discretionary and Healthcare sectors gained more than 2%, but the Tech sector gained nearly 16% in May led by strong gains in several semiconductor stocks. Given the strong performance in the Tech sector, it should be no surprise that growth-oriented stocks outperformed value-oriented stocks—the Russell 1000 Growth Index +7.2% vs. the Russell 1000 Value Index +3.0%. U.S. small caps also registered strong gains in May, with the Russell 2000 Index gaining 4.4%, but gains for U.S. mid-caps (Russell Mid Cap Index +2.9%) lagged. To underscore the narrowness of May’s market, the Philadelphia Semiconductor Index was up over 23% in May—and is up nearly 90% year to date—while the equal-weighted S&P 500 gained only about 2.7%.
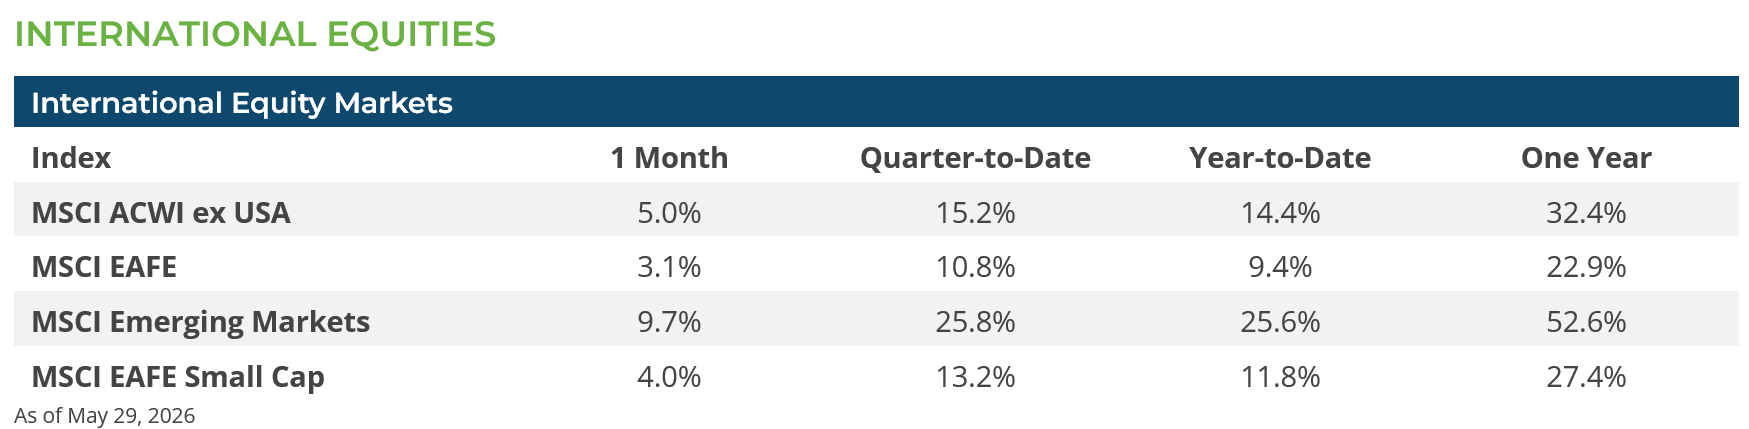
International equities also enjoyed a strong May, with Developed International markets (MSCI EAFE Index) gaining 3.1%. Meanwhile, Emerging Market equities (MSCI EM Index) gained 9.7% in May—powered again by strong returns from South Korea (MSCI Korea Index +35.0%) and Taiwan (MSCI Taiwan Index +16.3%). Indeed, the momentum behind the AI ecosystem is a global phenomenon. The main Korean stock market index (KOSPI) is up nearly 250% since January 2025, led by Samsung (+500%) and SK Hynix (+1,240%), both of which joined the global trillion-dollar market-cap club earlier this year and whose memory chips are vital to AI data center operations. The Taiwanese firm TSMC, which is the world’s largest fabricator of semiconductors, gained more than 112% over this period.
Volatility picked up mid-month in U.S. fixed income markets as April’s inflation data suggested that inflationary pressures were rising more than expected and prompted a sharp increase in longer-dated Treasuries. By mid-month, the yield on the 30-year Treasury closed at 5.18%, which was the highest level since mid-2007. The reasons for the rise in yields are multifaceted but share common themes. In most countries, inflation remains above central banks’ targets, government deficits are widening, and the U.S.-Iran war is exacerbating both issues. However, as talks between the U.S. and Iran made progress and ships began to transit the Strait of Hormuz, yields on longer-dated bonds eased in the final weeks of the month.
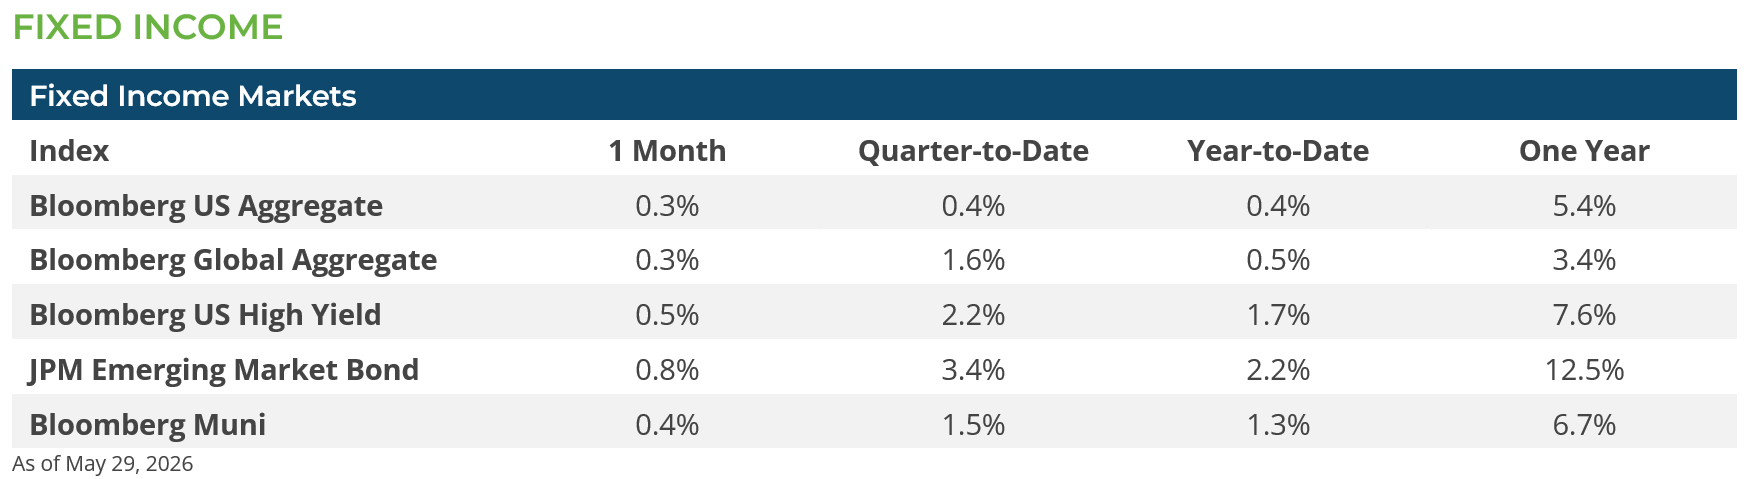
As stability returned to fixed income markets, the yield on the 10-year Treasury ended May with little change for the month, and spreads on both investment grade bonds and high yield bonds tightened marginally. Meanwhile, bonds continued to earn their coupons. The Bloomberg U.S. Aggregate Bond Index gained 0.3% in May, while the Bloomberg U.S. High Yield Index gained 0.5%. Emerging market debt (JPM Emerging Market Bond Index) gained over 0.8%, helped marginally by a weaker U.S. dollar against a broad basket of emerging market currencies.
CONCLUSION & OUTLOOK
As we head into the summer months, the enthusiasm for stocks tied to the AI ecosystem will likely remain jubilant. There is a bevy of mega-cap IPOs set to debut this summer and fall, beginning with SpaceX in June. These IPOs are likely to keep the AI trade front and center over the coming months. Momentum trades can continue longer than one might initially expect, and many of the companies that comprise the global AI ecosystem have had incredible earnings growth and are credibly projected to continue growing sales, cash flows, and profits over the coming quarters.
The summer months will also feature a growing narrative around the November midterm elections, that trading volume will inevitably thin, and the seasonal backdrop for equities will become more difficult. In addition, there are signs that leverage and borrowing are increasing as investors seek to capitalize on the momentum behind the recent rally in global AI stocks. Given these eye-popping returns, it is not hard to see why this would be the case. Nonetheless, history teaches us that investors should become cautious when leverage meets euphoria. At some point, as market leadership narrows, every day brings us closer to the day when the good news and upside are fully priced in, and all that remains is volatility.
Subscribe to our weekly Research Corner and other market commentary so you don’t miss our updates.
[1] Bloomberg LP 5/29/2026
DISCLOSURES: Information provided in this article is general in nature, is provided for informational purposes only, and should not be construed as investment advice. The views expressed by the author are based upon the data available at the time the article was written. Any such views are subject to change at any time based on market or other conditions. Clearstead disclaims any liability for any direct or incidental loss incurred by applying any of the information in this article. All investment decisions must be evaluated as to whether it is consistent with your investment objectives, risk tolerance, and financial situation. The performance data shown represent past performance. Past performance is not an indicator of future results. Current performance data may be lower or higher than the performance data presented.
Related or Tagged New Posts

market perspectives
July 8th 2026
June Review 2026
market perspectives
May 1st 2026
April Review 2026
market perspectives
April 1st 2026
March Review 2026
market perspectives
March 2nd 2026
February Review 2026

market perspectives
February 17th 2026
Beyond the Agg
market perspectives
February 2nd 2026
January Review 2026
market perspectives
January 6th 2026
December Review 2025
market perspectives
December 1st 2025
November Review 2025

market perspectives
December 1st 2025
Market Update | Private Credit
market perspectives
November 3rd 2025
October Review 2025
market perspectives
October 1st 2025
September Review 2025
market perspectives
September 2nd 2025
August Review 2025