The n=1 problem: Why Investing Successfully in a Single Early-Stage Company Is So Hard
Defining the n=1 problem
The frequency with which seed and early-stage investment opportunities are making their way to Clearstead and to our clients seems to be approaching a breakpoint, not surprising given that the number of new business formations remain well above historical levels.
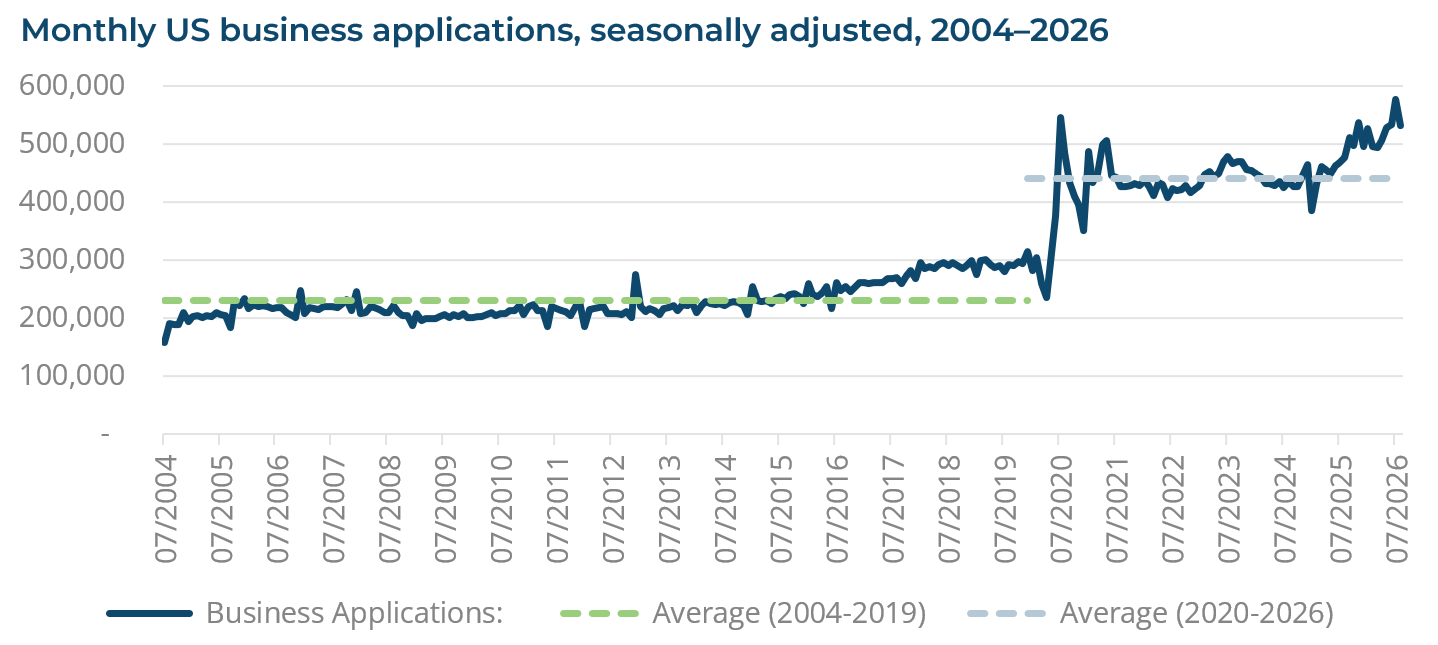
U.S. Census Bureau, Business Applications: Total for All NAICS in the United States [BABATOTALSAUS], retrieved from FRED, Federal Reserve Bank of St. Louis; https://fred.stlouisfed.org/series/BABATOTALSAUS, September 18, 2026.
Early-stage venture returns are not manufactured by picking a good company; they are manufactured by owning enough companies that a rare extreme outcome lands inside the portfolio. An investor who concentrates on a single early-stage company absorbs the full loss distribution of the asset class while forgoing the asymmetry of venture investing.
The supply side has expanded just as quickly. US VC investment is on pace to exceed $830 billion in 2026, more than 2.3x the prior high set in 2022.[1] Much of the early-stage flow reaching individual investors now arrives packaged as a single-asset special purpose vehicle (SPV), often assembled by syndicate leads or first-time sponsors on platforms that have made SPVs cheap and fast to launch. More offerings are not the same as more good offerings: activity in sub-$100 million rounds, the barometer for the “everyday” VC-backed company, remains roughly 30% below its peak,[2] which suggests the growth in syndicated offerings is not being matched by broad institutional appetite.
Venture capitalists deliberately concentrate capital in high-potential ventures knowing most will fail. The failure rate reaches as high as 75% — three of every four VC-backed companies either fail outright or never return the invested capital.[3] Portfolios succeed not by avoiding losses but by catching breakouts: under the ‘power law’, the majority of returns come from a very small number of exceptional outcomes.[4]
For funds, that asymmetry is a feature. For a single-company investor it is a bug: the −1X downside is fully borne, while the upside is reachable only at a probability far below the odds of total loss.
An illustrative 30-investment venture portfolio provides helpful context for how a diversified portfolio of venture investments returns to investors. Using power law assumptions, one position returns 50x — more than the other 29 combined — while a short tail returns 15x and 8x and roughly half the portfolio returns less than 1x, with the bottom third producing no returns.
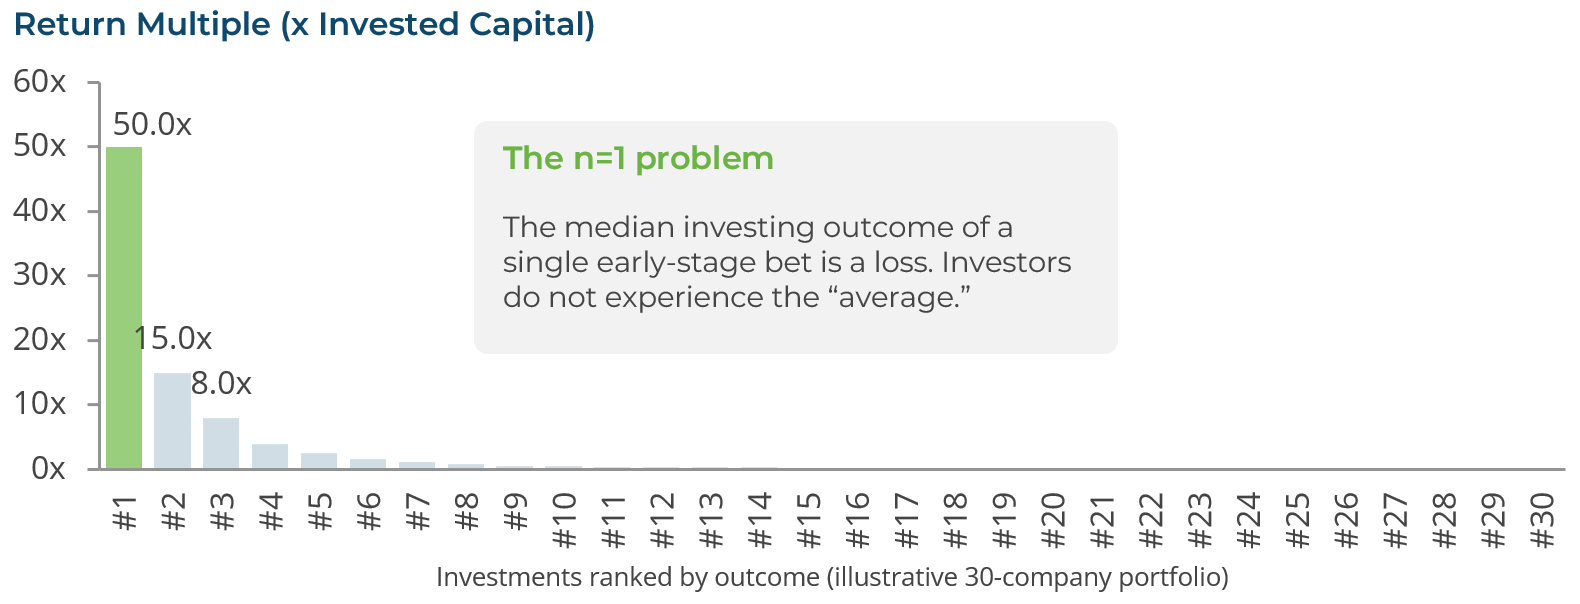
Source: Clearstead, Illustrative distribution based on the venture power law; up to 75% of VC-backed companies fail to return invested capital (Gompers et al., 2020; Strebulaev & Dang, 2024). Past performance is not an indicator of future returns.
Held as a portfolio, the distribution of outcomes can be viewed as attractive. A single investment drawn once is not. With n = 1, the probability of selecting the single outlier is about 3%, while the probability of landing in the sub-1x majority is roughly 50% and the probability of a near-total loss is close to one in three. Expected value stays high because the average is dragged upward by an outcome the typical investor will never experience; otherwise said, the median outcome of a single early-stage bet is a loss.
A More Challenging Environment
US VC-backed bankruptcies and failures have been steadily rising over recent years. After falling to 617 in 2020, bankruptcies and failures have risen to a record 2,345 in 2026 — nearly tripling in four years. Over one-third of 2026 failures were ZIRP-era companies founded in 2019–’21.[5] Cheap capital funded a cohort far larger than the follow-on market could support, and as runways ended, failures climbed.
The mix of outcomes is shifting as well. In 2026, there are roughly 2.5 VC-backed closures for every M&A exit or IPO among companies less than ten years old, compared with roughly one-to-one or better in 2021.[6] For a single-company investor, the most likely “exit” is increasingly a wind-down.
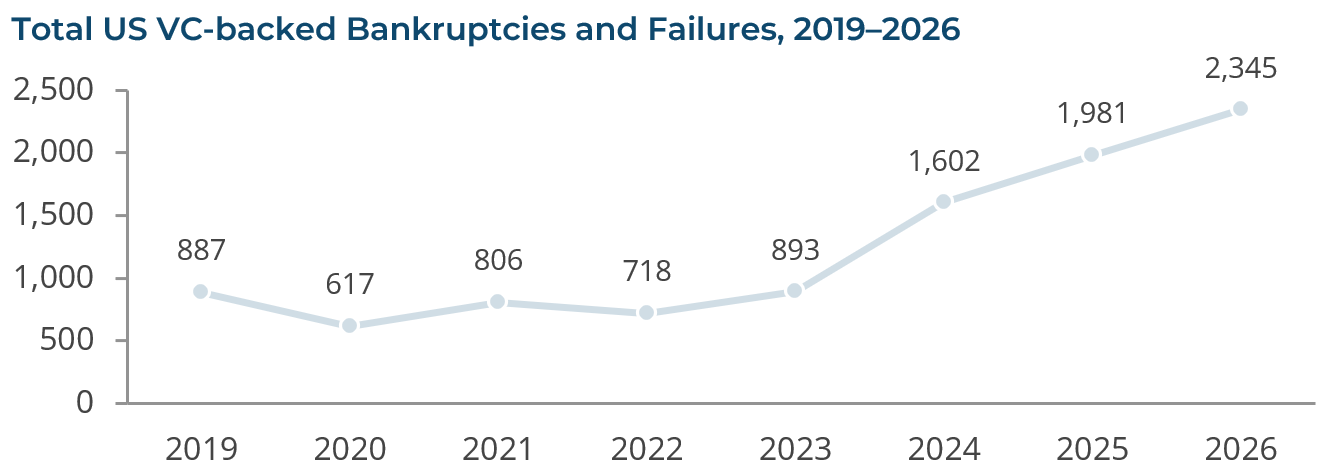
Source: Clearstead, PitchBook Data, Inc. and SVB analysis, 2026 figure is a trailing four-quarter total; includes companies with known founding years.
In recent years, capital access has been equally lopsided. In 2025, the bottom 50% of U.S. startups that closed a round raised just 14% of all cash, while the top 10% raised about half. [7] A single company chosen at random is far more likely to sit in the capital-starved half than in the funded decile — the decile where survival is financed.
Silicon Valley Bank’s (SVB) latest data shows that concentration is intensifying. The top 10 deals account for roughly 65% of all US VC deal dollars over the last twelve months, up from just 6% in 2022, and deals over $1 billion represent two-thirds of 2026 investment.[8] Reaching the next round has also become harder at the earliest stage: roughly 10–12% of the 2022 and 2023 seed cohorts had graduated to Series A within three years, compared with roughly 25% of the 2019 and 2020 cohorts.[9] Put differently, a seed-stage company today has roughly a one-in-ten chance of raising a Series A round within three years.
Narrative risk has risen too. SVB scored ~9,000 VC-backed companies that use AI language in their descriptions; in 2026, 42% scored low on evidence of core AI technology, versus 16% in 2016. Investors have largely priced this in, with low-scoring “AI” companies raising at a median valuation discount of about 21% to all US technology companies.[10] The takeaway for a single-asset investor: a pitch deck’s AI positioning is a claim to be reviewed, not a reason to invest.
Why Is This Deal Being Offered to You? The Adverse Selection Problem
The data above describes the average early-stage company. The deals that reach individual investors through single-asset SPVs are not a random draw from that population, and the selection tends to work against the investor. In venture, access is the scarce input. SVB notes that investors are “doubling down into perceived winners” and that prices reflect “the increased competition to get into the best deals.” When a round is truly oversubscribed, the lead investor’s main fund, existing insiders, and the lead’s core LPs typically absorb the allocation, and there is little reason to syndicate it widely. The rounds that reach a broad audience are therefore disproportionately the ones the best-informed investors chose not to fill themselves.
Economists call this the “lemons” problem: when one side of a transaction knows more about quality than the other, what is offered to the less-informed side skews toward lower quality.[11] In an SPV, the sponsor and lead investor have board-level information, relationships with the founders, and visibility into the next round. The SPV investor typically has a pitch deck and a deadline.
That does not make every syndicated deal a poor one. SPVs exist for legitimate reasons: a fund nearing its concentration limits, a smaller fund exercising pro-rata rights it cannot fully afford, or a GP offering co-investment to its existing LPs, discussed later in this piece. But the reason matters, and it is rarely stated in the offering materials. Common patterns include:
- Overflow at a stretched price: The lead GP’s fund has taken as much as it wants at the current valuation and syndicates the balance. The SPV investor is buying the portion a sophisticated buyer declined at that price.
- Pro-rata the fund will not fund: An early investor has rights in a new round but chooses not to use its own fund’s reserves. When insiders with the best information are not supporting a round from their own capital, that is a signal worth understanding.
- Sponsor incentives: A syndicate lead typically earns carry and fees on capital raised while committing little of its own, so the economic incentive is to raise capital, not necessarily to be selective. We see more co-investment deal flow structured as single-asset SPVs layered with management fees and carried interest. At some point, the single-asset SPV fees start to resemble a traditional primary drawdown fund without the underlying diversification.
- A seller on the other side: In SPVs that buy existing shares on the secondary market, an early employee or investor chooses to sell. Their reasons may be purely personal liquidity, but they know the company better than the buyer does.
- Compressed timelines: Short windows are common in competitive rounds, but they also limit the questions an investor can ask. An offering that cannot accommodate basic diligence should be treated with caution.
The practical test is alignment. Is the lead investor’s flagship strategy participating in this round, on the same terms and at a meaningful size relative to that fund? How much of the sponsor’s own capital is in the vehicle? Why is the allocation being syndicated rather than kept? Asking these questions (among others) will not eliminate adverse selection, but a sponsor unable or unwilling to answer them has, in effect, answered them.
Waiting For Confirmation in Future Rounds May Not Help a Single Asset Investor
The common defense of concentration is to invest later, after evidence accumulates. Dilution data shows why that trade is less protective than it looks. Median primary round dilution fell from 19.4% to 14.3% at Series B and from 14.7% to 10.7% in Series C between Q1 2020 and Q3 2024, while Series D rose from 12.7% to 15.5%. Later-stage entry buys less ownership per dollar, so the concentrated investor pays a higher price for a smaller claim on the one outcome that matters — and does so in a market where late-stage rounds are again re-pricing ownership upward at Series D.
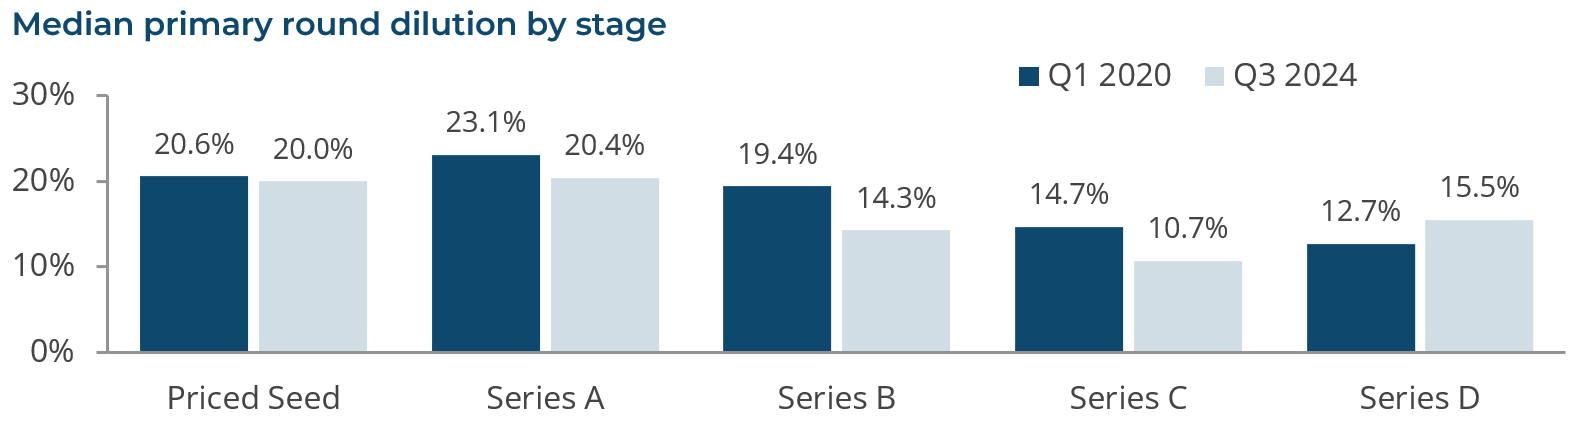
Source: Clearstead, Carta, Median primary round dilution by stage and quarter, Q1 2020 – Q3 2024.
A Liquidity Event Is Not the Same as a Return
Even a successful exit may not deliver the headline outcome. Roughly 75% of US VC-backed tech IPOs since 2025 have traded down in their first 90 days, with a median decline of 37% after the first-day pop. Lock-ups compound the problem: Uber traded 43% below its IPO price after its 180-day lock-up ended in 2019, and Facebook 47% below after its first expiration in 2012.[12] Investors typically sit behind the same lockups, with the sponsor controlling when shares are sold or distributed.
Bottom line
The difficulty of investing successfully in a single early-stage company is structural, not solely a matter of skill or diligence. The asset class pays through rare extreme outcomes that only a portfolio can capture, failure rates are high and rising, and capital is concentrating in a narrow top decile. One bet takes all the risk and only a small fraction of the mechanism that compensates for it. As these opportunities arise through professional networks, friends, and family, it is important to have context and discipline around how to approach these opportunities.
- Bets not Investments: Treat a single early-stage investment as a probable loss with a lottery attached. Size it to the amount you can write off entirely, not to a modeled expected value.
- Mean vs median: Judge outcomes against the median, not the mean. Expected-value arithmetic built on power-law math only works across many positions.
- Understand ‘n’: Meaningful exposure to venture requires enough positions that the tail is statistically reachable. Institutional investors that may sit on the cap table can provide an illusion of safety for your single investment, their ‘n’ and your ‘n’ are very different.
- Underwrite the follow-on market, not just the company: The 2019–’21 cohort failed largely because the next round never arrived, and capital concentration means most companies never reach it. Holding on to reserves for follow-on rounds may mitigate dilution but increases dollars at risk.
- Know the lead investor and vehicle: Diligence the sponsor, the fee and carry terms, the security held, and the investor’s rights with the same rigor as the company.
- Understand why the opportunity exits: Confirm whether the lead investor is investing with the same terms and understand why the allocation is being syndicated.
Considering a private investment opportunity? Before committing capital, talk with a Clearstead advisor about how the opportunity fits within your broader financial plan, risk tolerance, and portfolio strategy.
[1] Silicon Valley Bank, “State of the Markets H2 2026,” pp. 14 and 22. Source: PitchBook Data, Inc., Preqin and SVB analysis.
[2] Silicon Valley Bank, “State of the Markets H2 2026,” p. 7. Source: PitchBook Data, Inc. and SVB analysis.
[3] Gompers, P., Gornall, W., Kaplan, S. N., & Strebulaev, I. A. (2020). How do venture capitalists make decisions? Journal of Financial Economics, 135(1), 169–190. https://doi.org/10.1016/j.jfineco.2019.06.011; Ewens, M., & Marx, M. (2018). Founder replacement and start-up performance. Review of Financial Studies, 31(4), 1532–1565. https://doi.org/10.1093/ rfs/hhx130
[4] Strebulaev, I. A., & Dang, A. (2024). The venture mindset: How to make smarter bets and achieve extraordinary growth, pp. 6–8. Portfolio/Penguin. https://www.penguinrandomhouse.com/books/734114/the-venture-mindset-by-ilya-strebulaev and-alex-dang/
[5] Clearstead, 2026 figure is a trailing four-quarter total; includes companies with known founding years. Source: PitchBook Data, Inc. and SVB analysis
[6] Silicon Valley Bank, “State of the Markets H2 2026,” p. 33, ratio of VC-backed closures to M&A/IPOs by time since founding. Source: PitchBook Data, Inc. and SVB analysis.
[7] Carta, “At early stages of VC, rising round sizes and record-breaking valuations” March 2026. https://carta.com/data/record-setting-valuations/
[8] Silicon Valley Bank, “State of the Markets H2 2026,” p. 14. Source: PitchBook Data, Inc. and SVB analysis; data as of 7/26/2026.
[9] Silicon Valley Bank, “State of the Markets H2 2026,” p. 17. Source: PitchBook Data, Inc. and SVB analysis.
[10] Silicon Valley Bank, “State of the Markets H2 2026,” p. 14, SVB AI Relevance Score. Source: PitchBook Data, Inc. and SVB analysis.
[11] Akerlof, G. A. (1970). The market for “lemons”: Quality uncertainty and the market mechanism. Quarterly Journal of Economics, 84(3), 488–500.
[12] Silicon Valley Bank, “State of the Markets H2 2026,” pp. 31-32. Source: PitchBook Data, Inc., Crunchbase, S&P Capital IQ, S-1 filings and SVB analysis.
Disclosures:
Any performance data shown represents past performance. Past performance does not guarantee future returns. Current performance data may be lower or higher than the performance data presented. This document is intended exclusively for the use of the person to whom it has been delivered by Clearstead and is not to be reproduced or redistributed to any other person.
The information in this report is from sources believed by Clearstead Advisors, LLC (“Clearstead’) to be reliable as of the date listed or presented and is subject to change without notice. The views and “ratings” expressed herein are those of Clearstead investment professionals at the time comments were made, may not be reflective of their current opinions and are subject to change without notice.
This material is for informational purposes only and does not consider the investment objectives or financial situation of the person receiving this information. A person seeking information about an investment strategy represented in these materials should contact a financial professional to help evaluate as to whether it is consistent with a person’s investment objectives, risk tolerance, and financial situation.
The information contained herein or any opinion expressed shall NOT be construed to constitute an advertisement, investment advice, an offer to sell or a solicitation to buy any securities mentioned herein or other financial instruments. This commentary does not purport to provide any legal, tax, or accounting advice. Clearstead disclaims any liability for any direct or incidental loss incurred by applying any of the information in this report.
Performance of all citied indices is on a total return basis with dividends reinvested. Benchmarks may be included for informational purposes to measure the performance of investments compared to markets in general. Clearstead is making no claim that an included benchmark is the most appropriate for evaluating an investment strategy.
This material may contain information that has been generated or summarized using artificial intelligence (“AI”) tools. Although Clearstead employs processes designed to promote the accuracy and reliability of AI-generated content, AI-generated content may contain inaccuracies, omissions, or mischaracterizations of underlying source materials. AI tools are used solely to assist with research and document preparation and do not independently provide investment advice, determine investment suitability, or make investment decisions on behalf of clients.
Related or Tagged New Posts
market perspectives
November 19th 2024
Democratization of Private Markets and The Importance of Due Diligence

market perspectives
October 6th 2026
Quarterly Market Insights | 3Q26

market perspectives
October 6th 2026
September Review 2026

market perspectives
October 5th 2026
Research Corner | 10/5/2026
market perspectives
September 28th 2026
Research Corner | 9/28/2026
market perspectives
September 21st 2026
Research Corner | 9/21/2026
market perspectives
September 14th 2026
Research Corner | 9/14/2026
market perspectives
September 8th 2026
August Review 2026
market perspectives
September 8th 2026
Research Corner | 9/8/2026
market perspectives
August 31st 2026
Research Corner | 8/31/2026
market perspectives
August 24th 2026
Research Corner |8/24/2026
market perspectives
August 17th 2026
Research Corner | 8/17/2026