OBSERVATIONS
- Markets were mixed last week with the S&P 500 gaining 0.5% and small caps (Russell 2000) losing 1.5%. The yield on the 10-year Treasury fell 2 basis points to end the week at 4.72%.1
- The S&P Cotality Case-Shiller US National Home Price Index rose by 1.5% year-over-year (YoY) in June (latest available), up from May’s 1.2% YoY growth. There were strong gains in most Midwest and East Coast cities, but small price declines in many Western and West Coast cities.1
- New home sales registered 607k (annualized rate) in July, which was below expectations and 10.8% below June’s revised rate of 678k.1
- The Fed’s preferred gauge of inflation, the PCE Index, increased by 0.2% month-over-month (MoM), more than expected, leaving the headline PCE Index unchanged from June at 3.7% YoY. Core PCE, which removes the volatile food and energy categories, also rose 0.2% MoM, unchanged from June at 3.3% YoY.1
- Initial unemployment claims remain low and fell to 203k, which was a decline of 4k claims from the week prior. Compared to the same week last year, there were over 21k fewer claims.1
- The second estimate of Q2 real GDP growth was unchanged at 1.5% (annualized rate), but real final sales to private domestic purchasers—a proxy for total business and household demand—was revised higher to a healthy 4.2% (annualized rate)—the final estimate for Q2 real GDP growth will be released on 30-Sep.1
EXPECTATIONS
- In a wide-ranging speech last week, Fed Chairman Warsh conveyed a relatively hawkish message that the Fed was ready to take additional action if inflation failed to move closer to the 2% goal. Market pricing for a 25-basis point rate hike at the Fed’s September meeting increased from 36% prior to the speech to over 57% after the Friday morning speech.1
- Q2 earnings season was exceptionally strong. In the aftermath of NVIDIA’s strong earnings last week, the final numbers for Q2 show that S&P 500 earnings grew by 52% and top-line revenue by 15.5%. About 86% of firms had a positive earnings surprise, which was better than both the 5-year (78%) and 10-year (76%) for positive earnings surprises.2
ONE MORE THOUGHT: Calm August for Equities, Noisy month for Bonds.1
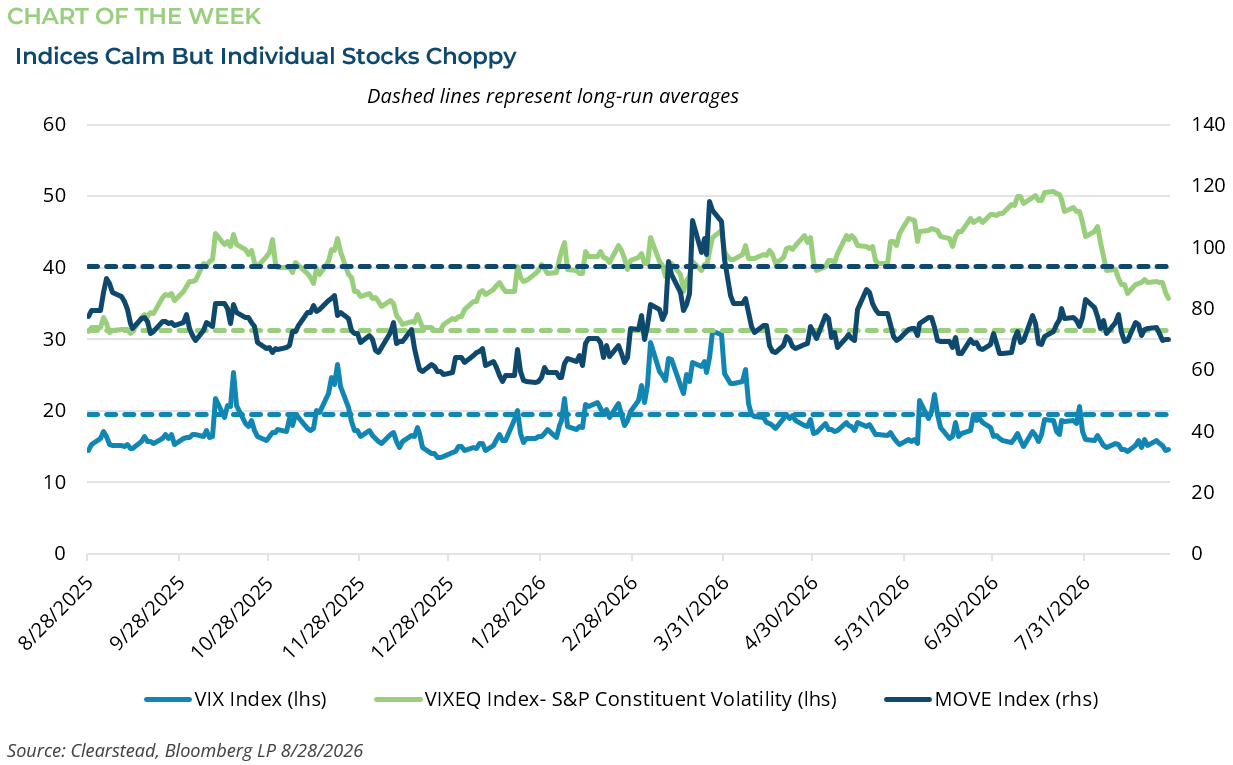
With only one trading day to go, August has shaped up to be a month of subtle contradictions. On the surface, markets broadly traded higher during the month, and index level volatility was muted. The VIX, often referred to as the market’s “fear gauge,” stayed below its long-term average throughout the month and reached a year-to-date low in mid-August. Equity performance was remarkably consistent across market segments, including cap size (Russell 1000 +3.2% vs Russell Midcap +2.4%), regions (S&P 500 +3.1% vs MSCI EAFE +2.4% vs MSCI EM +3.5%), and styles (Russell 1000 Growth +3.8% vs Russell 1000 Value +2.6%). Beneath the surface, however, market leadership and stock-level performance told a different story. The best-performing sectors were the highly cyclical Materials (+6.9%) and the traditionally defensive Healthcare (+5.3%) along with Tech (+5.9%), while Utilities (-3.6%), Real Estate (-1.1%), and Consumer Staples (-0.4%) posted losses. The CBOE S&P 500 Dispersion Index (DSPX), which measures the expected variation among S&P 500 constituents, traded well above its long-run average throughout August. Much of this dispersion was driven by AI and tech-related idiosyncratic stock trading, sharp sector rotations, and unusually low correlations between individual stocks. While equity trading—at least for index-oriented investors—could be seen as relatively calm in August, it was a more turbulent month for the US bond market. Longer-dated Treasury yields fell early in the month after several economic reports, most notably July employment data, came in weaker than expected, pushing the 10-year Treasury yield down to 4.62%. Yields then climbed sharply as US debt surpassed $40 trillion and investor attention shifted toward the nation’s fiscal outlook. On August 17, the 30-year Treasury yield reached 5.31%, its highest level since 2007. The move appeared to prompt the US Treasury to announce a series of long-dated bond purchases over the coming months. Yields subsequently retraced much of their recent rise, briefly revisiting early-August lows before reversing higher again during the final week of the month, creating significant volatility along the way. Despite the swings, the 10-year Treasury yield finished August largely unchanged at 4.72%. While August is typically characterized by light trading volumes as Wall Street heads off for late-summer vacations, this month’s headlines suggest the financial press did not enjoy the same luxury.

[1] Bloomberg LP, 8/28/2026
[2] FactSet Earnings Insight 8/28/2026
Information provided in this article is general in nature, is provided for informational purposes only, and should not be construed as investment advice. These materials do not constitute an offer or recommendation to buy or sell securities. The views expressed by the author are based upon the data available at the time the article was written. Any such views are subject to change at any time based on market or other conditions. Clearstead disclaims any liability for any direct or incidental loss incurred by applying any of the information in this article. All investment decisions must be evaluated as to whether it is consistent with your investment objectives, risk tolerance, and financial situation. You should consult with an investment professional before making any investment decision. Performance data shown represents past performance. Past performance is not an indicator of future results. Current performance data may be lower or higher than the performance data presented. Performance data is represented by indices, which cannot be invested in directly.
Related or Tagged New Posts

market perspectives
September 21st 2026
Research Corner | 9/21/2026
market perspectives
September 14th 2026
Research Corner | 9/14/2026

market perspectives
September 8th 2026
August Review 2026
market perspectives
September 8th 2026
Research Corner | 9/8/2026
market perspectives
August 24th 2026
Research Corner |8/24/2026
market perspectives
August 17th 2026
Research Corner | 8/17/2026
market perspectives
August 10th 2026
Research Corner 8/10/2026
market perspectives
August 7th 2026
July Review 2026
market perspectives
August 3rd 2026
Research Corner | 8/3/2026
market perspectives
July 27th 2026
Research Corner | 7/27/2026
market perspectives
July 20th 2026
Research Corner | 7/20/2026
market perspectives
July 13th 2026
Research Corner | 7/13/2026