OBSERVATIONS
- Markets traded higher last week with the S&P 500 and small caps gaining 0.4% and 1.2%, respectively. The yield on the 10-year Treasury was little changed, gaining 5 basis points to end the week at 4.69%.1
- The Small Business Optimism Index rose by 2.4 points in July to reach 99.8, above its long-run average of 98, as eight of the ten subcomponents improved. Of note, hiring expectations improved the most.1
- Existing home sales fell by 1.7% month-over-month (MoM) in July to 4.06 million (annualized rate) from June’s 4.09 million with declines in home sales in both the Midwest and South.1
- Inflation eased slightly in July with the headline CPI falling to 3.4% year-over-year (YoY), down from June’s 3.5% YoY figure. Core CPI, which removes the volatile food and energy categories, eased to 2.5% YoY, lower than June’s 2.6% YoY figure.1
- Prices at the wholesale level also eased in July. PPI fell to 4.7% YoY, down from June’s 5.5% YoY rate. Core PPI—removing food and energy—also fell in July to 4.2% YoY from June’s 4.7% YoY figure.1
- Initial unemployment claims increased by 10k last week to 209k. Claims remain very low and were over 12k fewer than in the same week last year.1
- Retail sales disappointed in July, with the headline figure declining 0.6% MoM—analysts had been expecting modest gains—while retail sales excluding the volatile autos and gas categories also declined in July by 0.2% MoM. Consumers pulled back particularly on eCommerce platform purchases.1
- The Univ. of Michigan Consumer Sentiment Index fell over 4 points to 51.0, ending two consecutive months of improvement, as lower-income and older consumers became less positive on the economy.1
EXPECTATIONS
- Congress has recessed for August, and both the House and Senate passed similar (but not identical) funding bills to keep the Federal Government funded until early December-2026. The two bills will need to be reconciled and passed before 30-September to avoid a government shutdown. Many in Congress, House members in particular, would prefer to focus on their campaigns in the coming months. A compromise is likely to be struck to avoid any shutdown-induced disruption in government services in the weeks preceding the November mid-term elections.1
- Q2 earnings season is nearly complete, with over 88% of S&P 500 constituents having reported. Roughly 86% of firms have delivered a positive earnings surprise, above the 5-year (78%) and 10-year (76%) averages. Overall, Q2 earnings are tracking towards 50.4% YoY growth.2
ONE MORE THOUGHT: Macro Data Still Largely Suggesting a Stable US Economy1
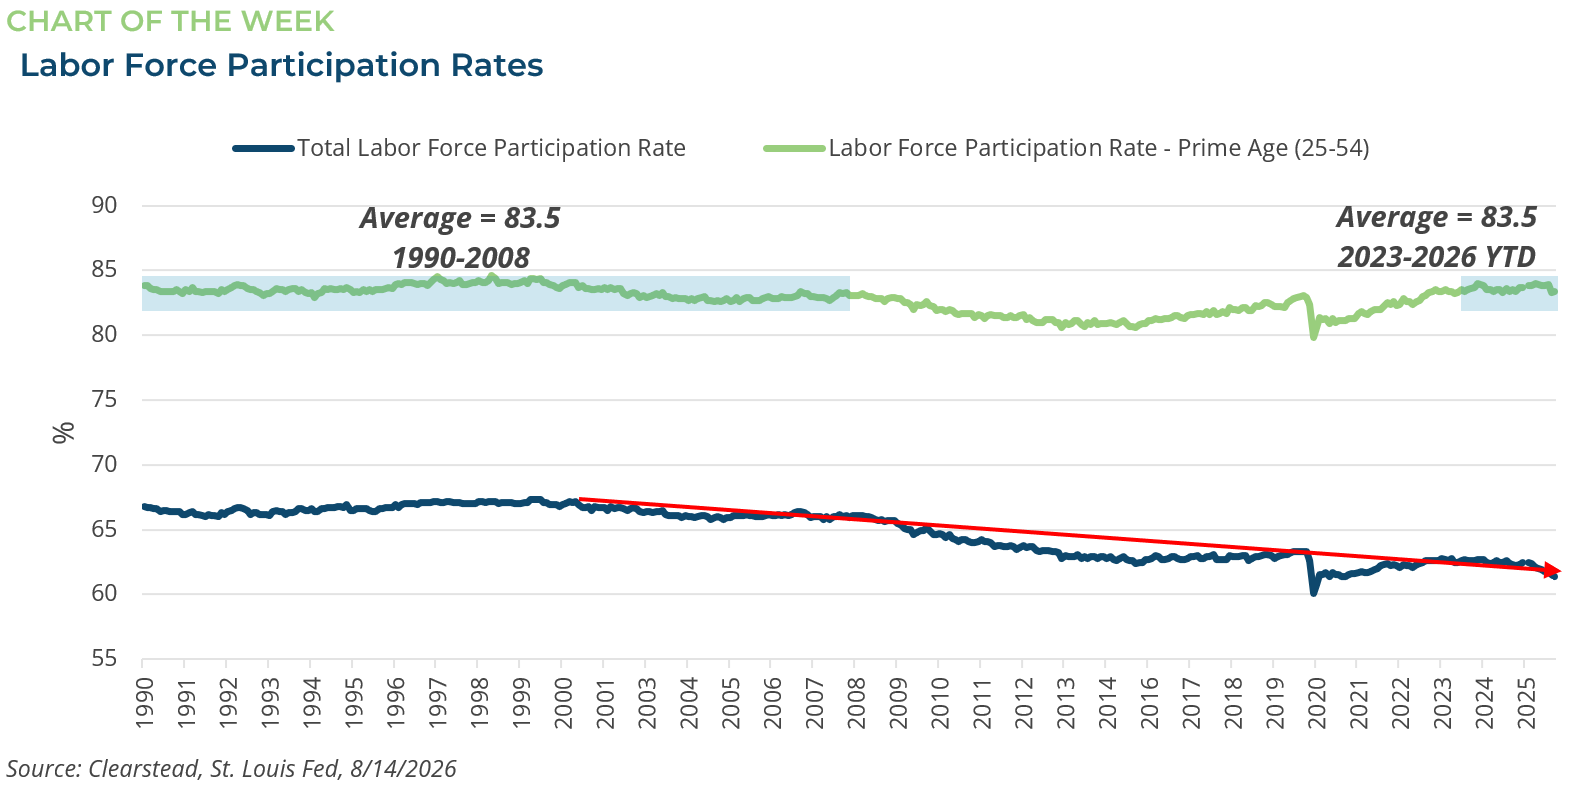
In recent weeks, we have received a slew of economic data that paint a picture of a stable economy. Early in the month, the July employment report showed the economy lost 23k jobs, while employment growth for both May and June was revised lower. The July report also showed that labor force participation declined, and average hourly earnings failed to keep pace with inflation. While the report was weaker than anticipated, there is nuance that bears consideration. First, as we have highlighted in previous notes (see RC 13-Oct-2025), a lack of immigration and slow growth in our labor force have reduced the breakeven jobs threshold—the number of new jobs needed to keep the unemployment rate stable—to about 50k. So far this year, the economy has averaged about 60k new jobs per month. Similarly, the falling labor force participation rate is largely a function of an aging of the US population. The participation rate of prime age workers (ages 25 to 54) sits at 83.4%, just below its 83.5% average since 2023 (see Chart of the Week). Recent retail sales numbers missed expectations in July, which was surprising given the recent World Cup tournament. However, through the first seven months of 2026, retail sales have increased by more than 5% YoY. While wage growth statistics have been lackluster, they are also nuanced. Wage growth for the lowest cohort—those paid at or around minimum wage—is close to 5% YoY, whereas middle and upper-tier wage earners have experienced weaker wage growth. In totality, this does not suggest labor market weakness. Low initial unemployment claims also support this view, running 6% lower through the first 32 weeks of 2026 compared to last year. Finally, the boom in AI-ecosystem spending remains a tailwind for the economy. Initial estimates for Q3 growth from the Atlanta Fed’s GDPNow model project over 4% real growth for the quarter. We expect this number to moderate in the coming months, as the net trade data will likely lower the estimate, but current model projections suggest an economy in expansion. Overall, while recent headlines have not been overly positive, a deeper examination of the data suggests a healthy labor market, a resilient consumer, and a stable economy—a positive backdrop for risk assets as we close out the summer.

[1] Bloomberg LP, 8/14/2026
[2] FactSet Earnings Insight 8/14/2026
Information provided in this article is general in nature, is provided for informational purposes only, and should not be construed as investment advice. These materials do not constitute an offer or recommendation to buy or sell securities. The views expressed by the author are based upon the data available at the time the article was written. Any such views are subject to change at any time based on market or other conditions. Clearstead disclaims any liability for any direct or incidental loss incurred by applying any of the information in this article. All investment decisions must be evaluated as to whether it is consistent with your investment objectives, risk tolerance, and financial situation. You should consult with an investment professional before making any investment decision. Performance data shown represents past performance. Past performance is not an indicator of future results. Current performance data may be lower or higher than the performance data presented. Performance data is represented by indices, which cannot be invested in directly.
Related or Tagged New Posts

market perspectives
September 21st 2026
Research Corner | 9/21/2026
market perspectives
September 14th 2026
Research Corner | 9/14/2026

market perspectives
September 8th 2026
August Review 2026
market perspectives
September 8th 2026
Research Corner | 9/8/2026
market perspectives
August 31st 2026
Research Corner | 8/31/2026
market perspectives
August 24th 2026
Research Corner |8/24/2026
market perspectives
August 10th 2026
Research Corner 8/10/2026
market perspectives
August 7th 2026
July Review 2026
market perspectives
August 3rd 2026
Research Corner | 8/3/2026
market perspectives
July 27th 2026
Research Corner | 7/27/2026
market perspectives
July 20th 2026
Research Corner | 7/20/2026
market perspectives
July 13th 2026
Research Corner | 7/13/2026