OBSERVATIONS
- Markets traded lower this week amid intensified fighting in the Middle East. The S&P 500 lost 0.6% and small caps (Russell 2000) lost 1.1%, while the yield on the 10-year Treasury moved up 13 basis points to end the week at 4.68%.1
- The Architectural Billing Index, a leading indicator of nonresidential construction activity, improved by three points in June to 47.3—any number below 50 denotes that most firms are seeing less activity—but continues to indicate that non-residential construction is seeing subdued activity.1
- New home sales increased in June to 628k (annualized rate), 1.6% above May’s 618k sales rate, however the number of new homes “permitted” but not yet started is 115k, which is a 50-year high.1
- Initial unemployment claims fell 22k last week to 187k, over 23k fewer claims than the same week last year and the fewest claims for this week going back to 1969.1
EXPECTATIONS
- The Trump administration released new tariffs last week it will use to replace the current 10% Section 122 global tariffs that expired on July 24. The new tariffs levy a 10% to 12.5% tariff on 60 trading partners based upon Section 301 Trade Act finding that these countries failed to curb the production of goods with forced labor which harms American workers. The new tariffs should be less vulnerable to a legal challenge.1
- The Fed meets this week, and the markets have priced in about a one-in-three chance that the Fed will hike rates at this meeting with a majority of traders expecting the Fed to hold rates steady. However, the odds of a 25-basis point rate hike by the Fed’s September meeting are about 100%.1
- Last week saw several major Q2 earnings releases including Tesla, Google (Alphabet), and Intel, and overall, Q2 earnings season is off to a strong start. About 27% of the S&P 500 have reported, and thus far 86% of firms have reported a positive earnings surprise, which is above the 5-year (78%) and 10-year (76%) averages, and Q2 earnings are tracking towards 37.9% year-over-year.2
ONE MORE THOUGHT: Recent Weeks see more Disruption and Higher Prices in Oil, Gas, and Diesel Markets1
As fighting between the US and Iran has intensified in recent weeks, tanker traffic through the critical Strait of Hormuz—the conduit for about 20% of pre-conflict oil supplies—has ground to a halt. Unsurprisingly, global energy prices are moving higher (again). In the aftermath of US-Iran ceasefire talks that took place from mid-April through mid-June, oil tankers and other ships began to transit the Strait of Hormuz, hitting a post-conflict high of 25 ships transiting the strait on June 24th. Accordingly, oil prices moved steadily lower with West Texas Intermediate (WTI) crude trading at $70 per barrel at the end of June, about $5 higher than before the US-Iran conflict began in late February. However, the breakdown in US-Iran peace talks and the resumption of kinetic military activity by both sides has, once again, pushed the price of oil higher. WTI ended last week trading close to $90 per barrel, and the price of gasoline nationally (AAA National Gas Prices – Regular) moved up to about $4.10 per gallon. The price of diesel (AAA National Gas Prices) is over $5.20 per gallon. Diesel prices have recently been more sensitive to the movement in energy prices—the margins for diesel refineries are at a four-year high—since Ukraine has damaged several Russian diesel refineries. Accordingly, Russian exports of refined diesel fuel have been largely pulled off the global market, resulting in tighter global supply than either refined gasoline products or unrefined crude oil. Energy markets could become even more volatile as, in solidarity with Iran, Houthi militias in Yemen have begun attacking ships transiting the Suez Canal and Red Sea at the Bab el-Mandeb Strait. As a result, several tankers and other transport ships have diverted away from this key passageway. This is relevant to oil markets as Saudia Arabia has diverted millions of barrels of crude oil away from its ports along the Strait of Hormuz via a pipeline to its Yanbu terminal on the Red Sea. Saudi crude exports transiting the Bab el-Mandeb Strait have risen from less than 250k barrels per day last year to over 3.5 million barrels per day last month. As of last week, the renewed fighting between the US and Iran can still be viewed as limited, and there remains a path toward ceasefire and additional peace talks. In such an event, oil markets may get a reprieve, and ships may, once again, begin to transit both the Strait of Hormuz and the Strait of Bab el-Mandeb. In the meantime, the US may choose to continue to draw down its strategic oil reserves and increase the supply of oil available for sale to blunt the rise of oil prices. As the supply of US strategic oil reserves dwindles—it has now fallen to close to 1985 levels—and Iran runs out of space to store oil in the face of the US blockade of its oil exports, both sides have incentive to resume talks. How quickly that happens remains uncertain and will likely remain the most important question for oil traders in the weeks ahead.
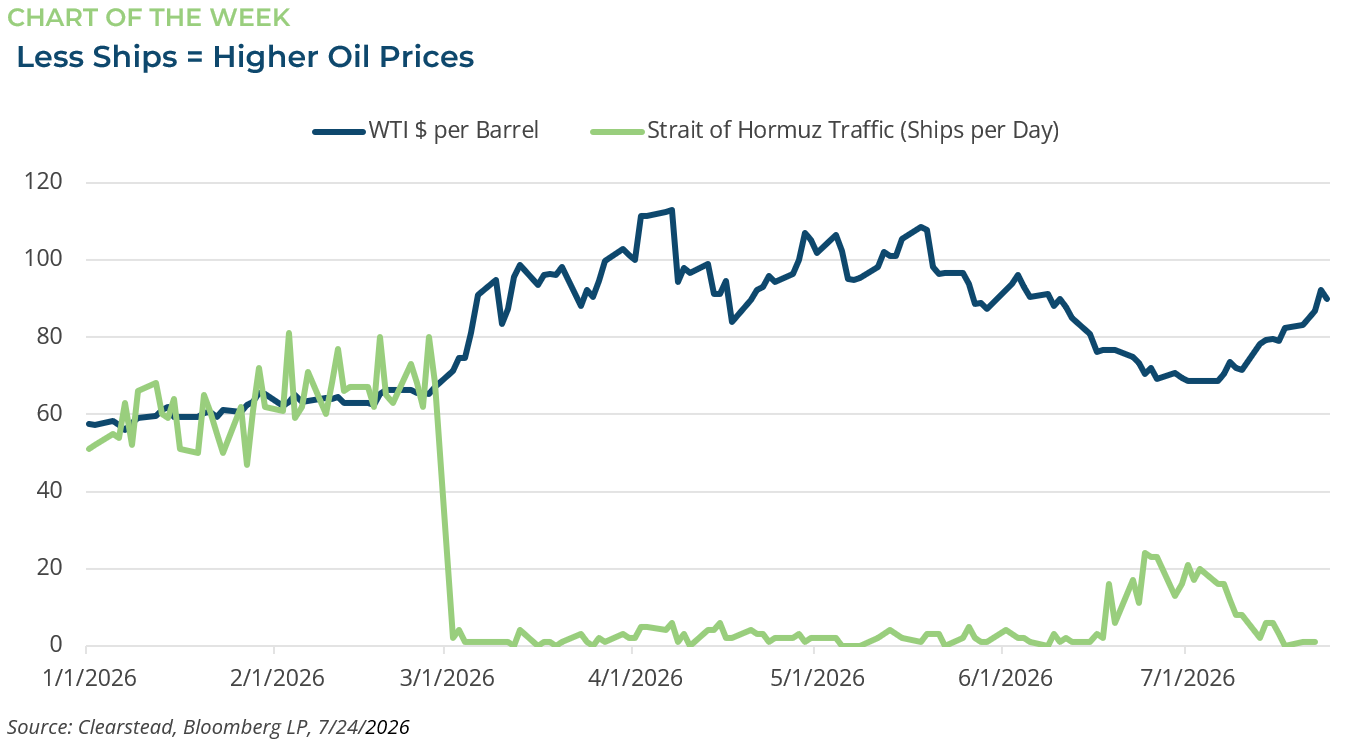

[1] Bloomberg LP, 7/24/2026
[2] FactSet Earnings Insight 7/24/2026
Information provided in this article is general in nature, is provided for informational purposes only, and should not be construed as investment advice. These materials do not constitute an offer or recommendation to buy or sell securities. The views expressed by the author are based upon the data available at the time the article was written. Any such views are subject to change at any time based on market or other conditions. Clearstead disclaims any liability for any direct or incidental loss incurred by applying any of the information in this article. All investment decisions must be evaluated as to whether it is consistent with your investment objectives, risk tolerance, and financial situation. You should consult with an investment professional before making any investment decision. Performance data shown represents past performance. Past performance is not an indicator of future results. Current performance data may be lower or higher than the performance data presented. Performance data is represented by indices, which cannot be invested in directly.
Related or Tagged New Posts

market perspectives
September 28th 2026
Research Corner | 9/28/2026
market perspectives
September 21st 2026
Research Corner | 9/21/2026
market perspectives
September 14th 2026
Research Corner | 9/14/2026

market perspectives
September 8th 2026
August Review 2026
market perspectives
September 8th 2026
Research Corner | 9/8/2026
market perspectives
August 31st 2026
Research Corner | 8/31/2026
market perspectives
August 24th 2026
Research Corner |8/24/2026
market perspectives
August 17th 2026
Research Corner | 8/17/2026
market perspectives
August 10th 2026
Research Corner 8/10/2026
market perspectives
August 7th 2026
July Review 2026
market perspectives
August 3rd 2026
Research Corner | 8/3/2026
market perspectives
July 20th 2026
Research Corner | 7/20/2026