OBSERVATIONS
- Markets were positive last week despite the US-Iran conflict continuing to flare, and sliding global AI stocks. The S&P 500 gained 1.1%, while small caps (Russell 2000) gained 0.1% and the yield on the 10-year Treasury rose 6 basis points to end the week at 4.74%.1
- Durable goods increased by 0.3% month-over-month (MoM) in June, which was well below expectations, but well ahead of May’s 4.5% MoM decline. Excluding the volatile transportation category, durable goods orders gained 0.6% MoM, but this figure was also weaker than expected.1
- The S&P Cotality Case-Shiller US National Home Price Index edged up to 1.1% year-over-year (YoY) in May (latest available), up from April’s 0.9% YoY growth.1
- The PCE Index, the Fed’s key inflation measure, fell to 3.7% YoY in June, down from May’s 4.1% YoY rate. Core-PCE, which removes the volatile food and energy categories, rose 3.3% YoY in June, edging lower from May’s 3.4% YoY rate.1
- Initial unemployment claims remain very low with 197k new claims registered last week. This is an increase of 9k from the week prior, but 18k less than the same week last year.1
- The Employment Cost Index showed that wages and benefits increased by 3.4% YoY for Q2, which was the same rate of increase as in Q1 and similar to June’s average hourly earnings report (3.5% YoY).1
EXPECTATIONS
- The final estimate of Q2 real GDP showed that the economy only expanded by 1.5%—below the earlier estimates. The lower revision to economic activity for Q2 was driven by weaker exports and inventory accumulation. Despite this, consumer spending was robust—growing at a 3.2% annualized rate—but may have been boosted by one-off factors such as the World Cup and Spring tax refunds.1
- The Federal Reserve left rates unchanged last week at 3.5% to 3.75% in a nine-to-three vote. All three dissenting votes were in favor of a 25-basis point rate hike. The Fed’s tone was terse, emphasizing that economic activity remains solid, the labor market is stable, and inflation continues to be elevated.1
- Q2-earnings continue to impress. With 61% of the S&P 500 having reported—including Microsoft, Meta, and Apple—about 86% of firms have had a positive earnings surprise, which is above the 5-year (78%) and 10-year (76%) averages. Overall Q2 earnings are tracking towards 47.4% YoY growth.2
ONE MORE THOUGHT: Global AI- Oriented Momentum Trades Unwind in July1
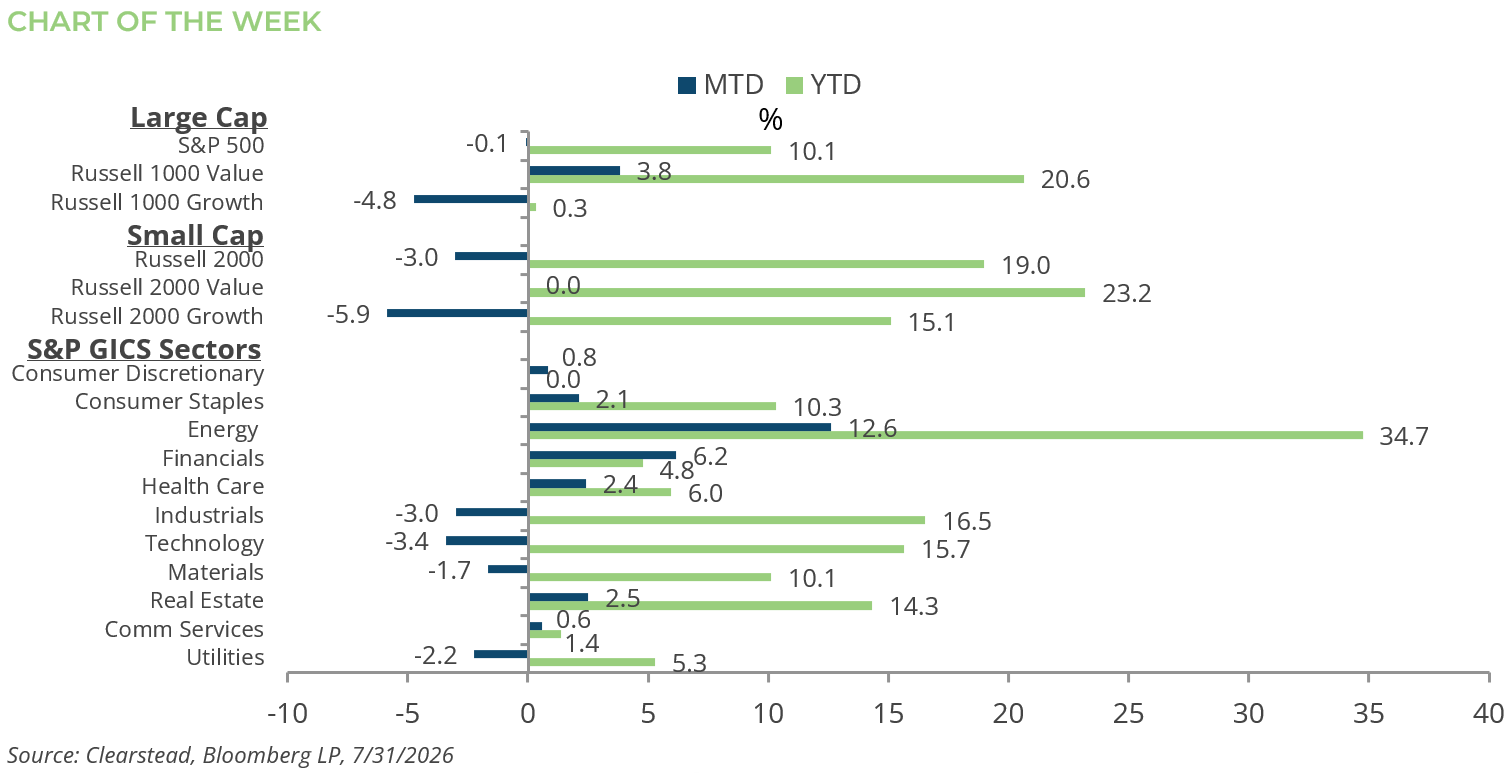
Global equity markets looked markedly different in July than they did during the second quarter. Q2 saw narrow equity leadership, with a small group of AI ecosystem companies in the memory and semiconductor space leading all other sectors and themes. As you may recall (see the Q2 Quarterly Note), the Philadelphia Semiconductor (SOX) Index gained more than 90% during the quarter. The Korean stock market, which is dominated by memory chip companies Samsung and SK Hynix, gained more than 85%. However, the strong momentum behind these trades began to unwind in July. The Philadelphia SOX Index lost 28.6% from its peak in June to its low point in late July. The Korean KOSPI Index fell more than 38% from its record high in June. Trading in Korea was halted several times during the final trading days of the month as daily losses exceeded 10%. The Taiwanese stock market (MSCI Taiwan Index) also corrected in July, as did the broader MSCI Emerging Markets Index. Within the U.S., the tech-heavy NASDAQ declined 9.8% from its record high in June to its lowest point in July. Accordingly, the NASDAQ 100 formally entered correction territory, defined as a decline of 10% or more from a recent high, having fallen 11.3% in the final week of July from its June high. However, while many of the high-flyers from Q2 sold off, investors did not reallocate to cash. Rather, many of the sectors and themes that had lagged year to date (YTD) posted strong returns in July. Investors rotated into more defensive and value-oriented areas of the market. In the end, seven of the eleven S&P 500 sectors posted gains in July, while four delivered negative returns (see Chart of the Week). The Russell 1000 Value Index gained approximately 4% in July, while the Russell 1000 Growth Index lost about 5%. The Healthcare sector, which had been one of the worst-performing sectors during the first half of 2026, gained more than 2% in July, doubling its YTD return. Overall, the S&P 500 lost less than 1% in July but remains only 2% below its all-time high, set in early June. In recent weeks, Clearstead has posited (see Research Corner: July 13 and June 22) that leverage and speculation were increasingly driving gains in select areas of the market and that caution was warranted. The AI-oriented, momentum-driven market produced impressive gains during the first half of the year, but a diversified portfolio may offer a smoother and potentially more rewarding ride in the quarters and years ahead.

[1] Bloomberg LP, 7/31/2026
[2] FactSet Earnings Insight 7/31/2026
Information provided in this article is general in nature, is provided for informational purposes only, and should not be construed as investment advice. These materials do not constitute an offer or recommendation to buy or sell securities. The views expressed by the author are based upon the data available at the time the article was written. Any such views are subject to change at any time based on market or other conditions. Clearstead disclaims any liability for any direct or incidental loss incurred by applying any of the information in this article. All investment decisions must be evaluated as to whether it is consistent with your investment objectives, risk tolerance, and financial situation. You should consult with an investment professional before making any investment decision. Performance data shown represents past performance. Past performance is not an indicator of future results. Current performance data may be lower or higher than the performance data presented. Performance data is represented by indices, which cannot be invested in directly.
Related or Tagged New Posts

market perspectives
September 28th 2026
Research Corner | 9/28/2026
market perspectives
September 21st 2026
Research Corner | 9/21/2026
market perspectives
September 14th 2026
Research Corner | 9/14/2026

market perspectives
September 8th 2026
August Review 2026
market perspectives
September 8th 2026
Research Corner | 9/8/2026
market perspectives
August 31st 2026
Research Corner | 8/31/2026
market perspectives
August 24th 2026
Research Corner |8/24/2026
market perspectives
August 17th 2026
Research Corner | 8/17/2026
market perspectives
August 10th 2026
Research Corner 8/10/2026
market perspectives
August 7th 2026
July Review 2026
market perspectives
July 27th 2026
Research Corner | 7/27/2026
market perspectives
July 20th 2026
Research Corner | 7/20/2026