OBSERVATIONS
- The market rallied this week as the S&P 500 gained 3.6%, small caps (Russell 2000) moved up 3.5%, and the yield on the 10-year Treasury fell 9 basis points to finish the week at 4.65%.1
- The ISM Manufacturing PMI jumped to 55.6 in July—any figure above 50 denotes expansion—up 2.3 points from June’s 53.3 reading and the highest level since May 2022. The employment component rose to 52.8 from 49.7, its first month of expansion in 33 months. The prices paid component eased to 71.1 from 73.0.1
- The US trade deficit narrowed 5.6% to $73.3 billion in June from May’s revised $77.6 billion, as a 1.8% drop in imports to $388.0 billion outpaced a 0.9% drop in exports to $314.7 billion.1
- Job openings fell to 7.359 million in June (latest available) from May’s revised 7.537 million, a level the Bureau of Labor Statistics described as “little changed.” Hires ticked up to 5.348 million while quits, a proxy for worker confidence, edged up to 3.232 million.1
- Initial unemployment claims remain very low with 199k new claims registered last week. This is an increase of 1k from last week’s revised number of 198k claims, but 27k fewer than the same week last year.1
- The July jobs report was weak compared to expectations, losing 23k jobs along with revising the past two-month payrolls down 103k. The unemployment rate moved down to 4.1% as labor participation fell and average hourly earnings year-over-year (YoY) came in slightly below expectations at 3.2%.1
EXPECTATIONS
- Treasury Secretary Bessent signaled that the US and Iran may be near an agreement to reopen the Strait of Hormuz. WTI crude fell ~8%, ending the week around $78 per barrel. However, there has not been an official deal yet, and with the two sides still divided over control of the strait and transit fees, the path towards de-escalation could be bumpy.1
- July CPI and PPI are to be released Wednesday and Thursday, giving the market new evidence on which direction inflation is heading and what that means for the Fed’s September decision. June’s CPI reading saw a 0.4% month-over-month (MoM) decline, the largest monthly drop since April 2020, largely due to lower energy prices. However, energy prices moved higher through late July, which could push Wednesday’s reading higher.1
ONE MORE THOUGHT: July 2026 in Review & Overstated Earnings1,2
The S&P 500 was essentially flat in July, masking sharp divergence and trend reversal beneath the surface. The Nasdaq fell 3.2% during the month and small-cap stocks, as measured by the Russell 2000, declined 3.0%. The US Semiconductor Index fell by nearly 21%. Notably, the equal-weighted S&P 500 outperformed the Nasdaq-100 by roughly 7.6% for the month—its best relative showing since the Nasdaq Index was created in 1985. The driver of this rotation was a pronounced shift away from mega-cap technology and toward cyclical, value-oriented sectors caused by a reversal of the over-extended momentum factor as well as an enormous margin call on a heavily levered AI-focused hedge fund. Energy surged 12.6%, Financials gained 6.2%, and Real Estate and Consumer Staples posted solid mid-single-digit advances. By contrast, Technology slipped 3.4%, and Industrials fell 3.0%, as investors grew more discerning about the pace and payoff of AI-related capital spending. Currently, the pullback in mega-cap Tech appears to reflect valuation, positioning, and forced-liquidation dynamics rather than a deterioration in underlying fundamentals. International equities told a more constructive story. Developed markets gained roughly 2.0% in July, closing the month at a fresh high—one of the few corners of global equities to buck the mega-cap Tech unwind. After an AI-related move higher in the first half of the year, emerging markets fared worse, falling by 3.1% during the month. The US dollar softened modestly in July despite a resilient domestic economy. The more dramatic move came in energy markets: WTI crude oil surged over 20% during the month, whipsawing between the collapse of wartime risk premiums early in the month and renewed Middle East tensions that fueled a mid-month rally.
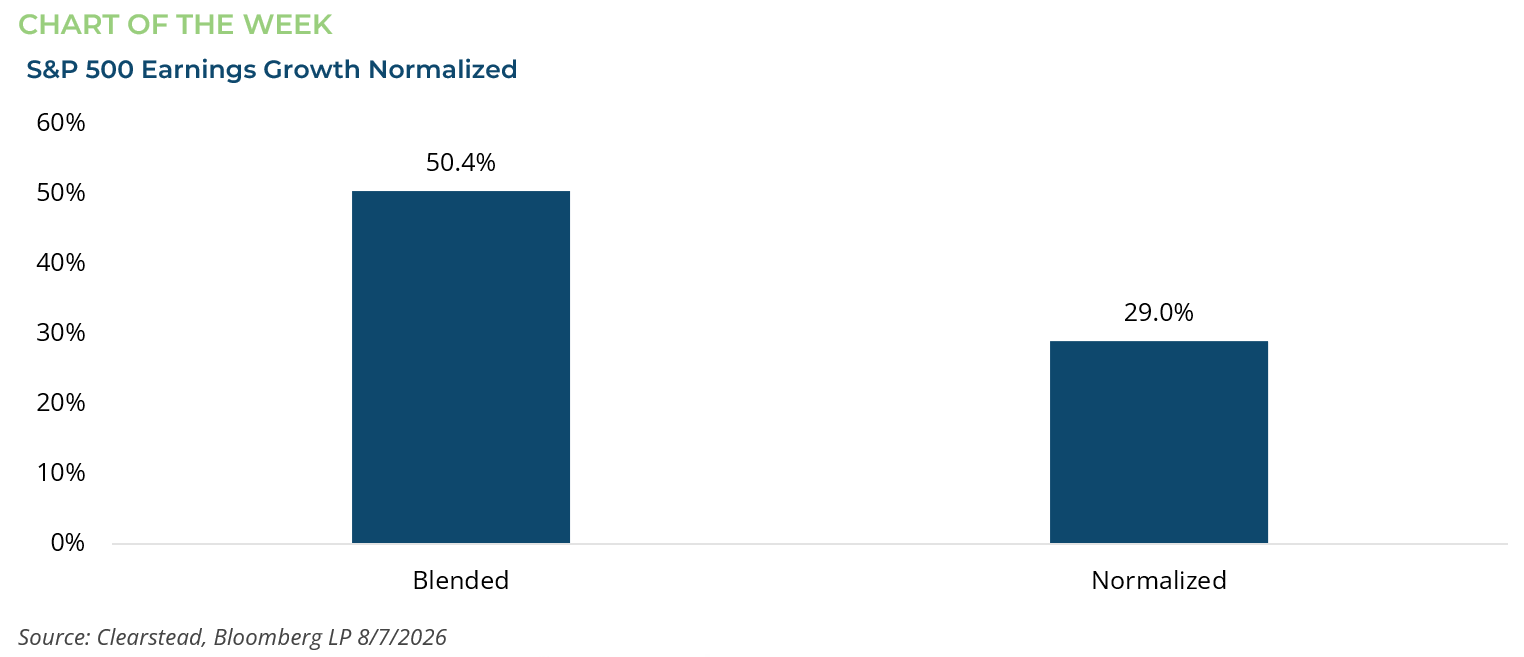
Q2 2026 earnings have been extraordinary. With 88% of S&P 500 companies having reported, blended earnings growth is 50.4%—the strongest showing since 2021—alongside EPS beat rates well above historical norms. But this headline figure deserves scrutiny as a disproportionate share of that growth traces to just two companies: Alphabet/Google and Amazon. Alphabet’s results included roughly $99 billion in unrealized, non-operating gains tied to its equity stake in SpaceX, while Amazon booked approximately $53 billion in similar paper gains from its investment in Anthropic. Combined, these two mark-to-market adjustments—required under GAAP accounting for equity holdings—account for over $150 billion in reported profit that has nothing to do with the core business in either case. Strip out Alphabet and Amazon entirely, and blended S&P 500 earnings growth falls from the low-50% to roughly 29%, still a strong quarter, but no longer a record-setter.

[1] Bloomberg LP, 8/7/2026
[2] FactSet Earnings Insight 8/7/2026
Information provided in this article is general in nature, is provided for informational purposes only, and should not be construed as investment advice. These materials do not constitute an offer or recommendation to buy or sell securities. The views expressed by the author are based upon the data available at the time the article was written. Any such views are subject to change at any time based on market or other conditions. Clearstead disclaims any liability for any direct or incidental loss incurred by applying any of the information in this article. All investment decisions must be evaluated as to whether it is consistent with your investment objectives, risk tolerance, and financial situation. You should consult with an investment professional before making any investment decision. Performance data shown represents past performance. Past performance is not an indicator of future results. Current performance data may be lower or higher than the performance data presented. Performance data is represented by indices, which cannot be invested in directly.
Related or Tagged New Posts

market perspectives
September 14th 2026
Research Corner | 9/14/2026

market perspectives
September 8th 2026
August Review 2026
market perspectives
September 8th 2026
Research Corner | 9/8/2026
market perspectives
August 31st 2026
Research Corner | 8/31/2026
market perspectives
August 24th 2026
Research Corner |8/24/2026
market perspectives
August 17th 2026
Research Corner | 8/17/2026
market perspectives
August 7th 2026
July Review 2026
market perspectives
August 3rd 2026
Research Corner | 8/3/2026
market perspectives
July 27th 2026
Research Corner | 7/27/2026
market perspectives
July 20th 2026
Research Corner | 7/20/2026
market perspectives
July 13th 2026
Research Corner | 7/13/2026
market perspectives
July 8th 2026
Quarterly Market Insights | 2Q26