OBSERVATIONS
- Equity markets traded lower last week, and interest rates were volatile and ended the week higher. The S&P 500 lost 1.4% and small caps (Russell 2000) lost 1.6%, while the yield on the 10-Year Treasury rose 4 basis points to end the week at 4.74%.1
- NAHB Housing Market Index inched up 1 point to 35 in August, but there was no improvement in current foot traffic of prospective buyers nor any improvement in expectations for home sales in the next six months.1
- Housing starts fell 12.4% month-over-month (MoM) to 1.239 million (annualized rate) in July. Starts declined for both single-family homes and multi-family units.1
- Industrial production climbed 0.2% MoM in July, which was just below June’s 0.3% MoM increase. Compared to last year, industrial production was 1.1% higher and capacity utilization edged up to 76.3%.1
- Initial unemployment claims remain low, registering only 206k new claims last week, which was a 6k decrease from the week prior. Compared to the same week last year, there were 22k fewer claims.1
EXPECTATIONS
- FOMC minutes indicated that, while the majority of Fed officials were comfortable keeping rates steady at its last meeting, there were three dissents arguing that a 25-basis-point hike now could forestall a “potential more costly sequence of tightening” at a later point and that “many” Fed officials felt that rate hikes would be necessary if inflation did not decline—presumably during the back half of the year.1
- The Trump administration paused the 50% tariffs that were due to be levied on about $20 billion of Canadian exports to the US—about 5% of total Canadian exports to the US—last week as the two sides reached a deal to allow greater access to US exports to Canada as well as alignment on digital trade issues—taxes on US internet firms. This trade deal may help lift broader US-Canada trade talks related to extending the larger USMCA trade deal—so-called “NAFTA 2.0”.1
- Global central bankers will gather at the annual Jackson Hole Economic Policy Symposium this week, with Kevin Warsh delivering his first keynote as Fed Chair on Friday morning. Markets will be closely watching if Warsh breaks from his recent pattern of minimal forward guidance and provides any hints regarding the trajectory of Fed policy.1
ONE MORE THOUGHT: Speculation Made Easy1,2
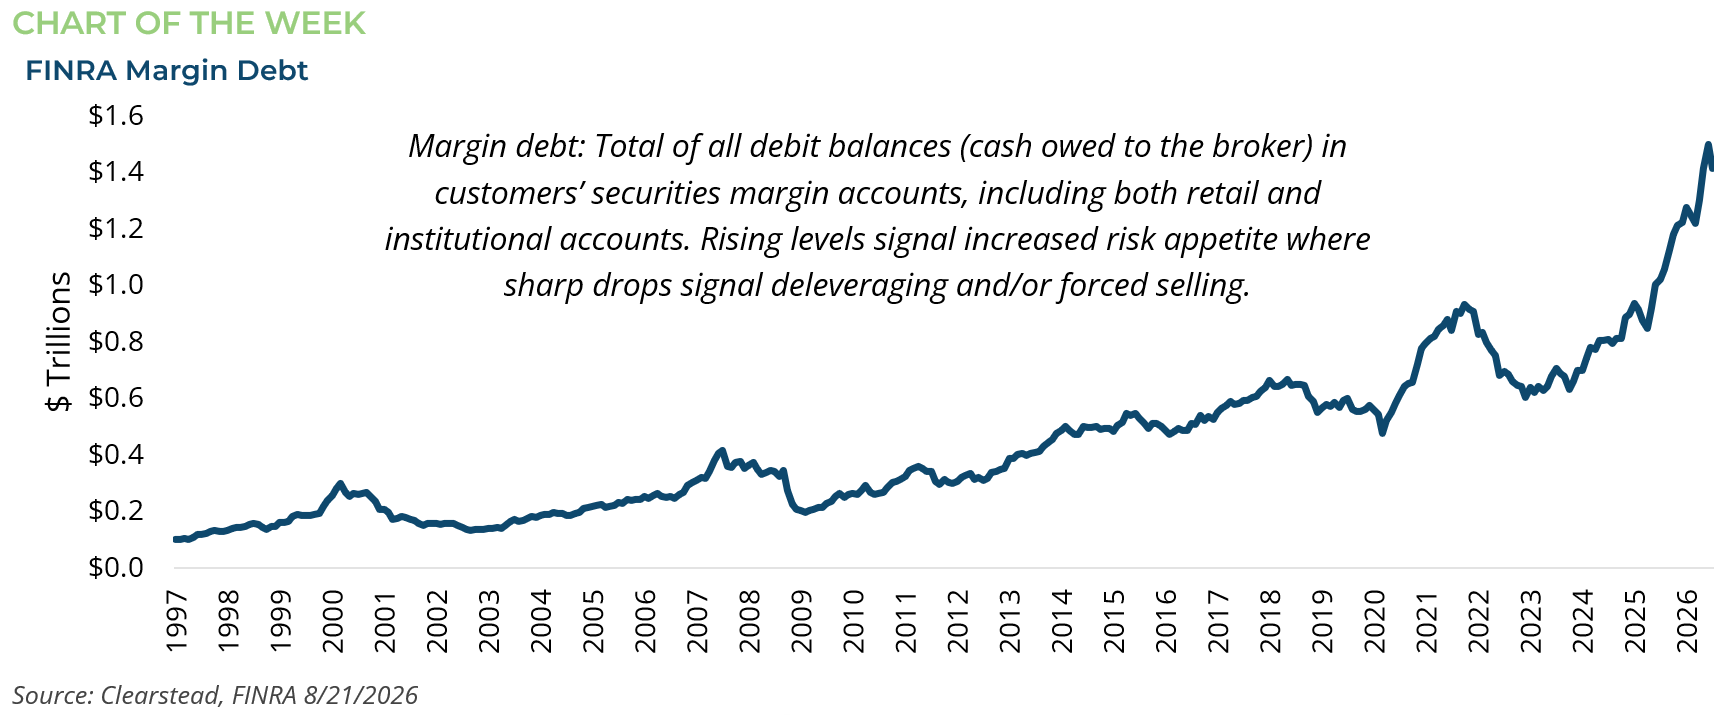
Innovation is alive and well in financial markets. This year alone, there has been a proliferation of new products both in the US and globally that has allowed retail investors to invest in a variety of assets utilizing leverage and magnifying the returns to underlying risk assets. For instance, in July the CME Group relaunched single-stock futures on more than 50 large US companies, offering leveraged, cash-settled exposure at a regulatory minimum initial margin of 15% of notional value—against the roughly 50% that Regulation T requires in the cash equity market. Just this month, Kalshi filed with the Commodity Futures Trading Commission (CFTC) to list perpetual futures on a US equity index—contracts with no expiration date that allow a trader to hold a leveraged long or short position on the S&P 500 indefinitely without ever owning a share. Kalshi’s crypto perpetuals, approved in late May, cleared $1 billion in notional volume in their first week. Also in May, Korean regulators approved leveraged exchange-traded funds (ETFs) on several blue-chip Korean stocks including Samsung Electronics and SK Hynix, which attracted over $10 billion from mostly retail Korean investors. Leverage, on its own, does not cause a market to turn, but it determines how quickly the turn is transmitted. When momentum shifted in late June, SK Hynix lost over 50% from peak to trough in just one month, but those invested in the levered ETF lost more than 80%, which prompted Korean officials to apologize for their introduction. Korea’s experience notwithstanding, the appetite for leverage is clearly visible in the data. FINRA margin debt reached a record $1.5 trillion in June, up roughly 49% from a year earlier—see Chart of the Week. Leveraged ETFs in the US have also taken off during the rally in technology, artificial intelligence, and semiconductor funds earlier this year. Fund flows show that in the three months ending in July, leveraged ETFs saw their strongest three-month inflow on record—nearly $13 billion. As the summer winds down, the fundamental case for equities remains intact: Q2 earnings are tracking above 50% growth, the economy continues to expand, and momentum could persist longer than skeptics expect. Positioning remains an important piece of the puzzle. Record margin balances, concentrated leveraged-ETF assets, and a steady stream of new products launched into a market at record highs are the conditions under which an ordinary correction can become a disorderly one. With the introduction of new products that reduce the barriers to leverage, investors could view this as an opportunity to win big. However, as leverage amplifies returns on the way up, it does the same on the way down. As financier John Hussman has noted in the past, every cycle finds a new way to make speculation feel like investing, and this one has found several.

[1] Bloomberg LP, 8/21/2026
[2] Summer road trip: Resilient fundamentals remain in the driver’s seat for ETF flows, 8/4/2026
Information provided in this article is general in nature, is provided for informational purposes only, and should not be construed as investment advice. These materials do not constitute an offer or recommendation to buy or sell securities. The views expressed by the author are based upon the data available at the time the article was written. Any such views are subject to change at any time based on market or other conditions. Clearstead disclaims any liability for any direct or incidental loss incurred by applying any of the information in this article. All investment decisions must be evaluated as to whether it is consistent with your investment objectives, risk tolerance, and financial situation. You should consult with an investment professional before making any investment decision. Performance data shown represents past performance. Past performance is not an indicator of future results. Current performance data may be lower or higher than the performance data presented. Performance data is represented by indices, which cannot be invested in directly.
Related or Tagged New Posts

market perspectives
September 28th 2026
Research Corner | 9/28/2026
market perspectives
September 21st 2026
Research Corner | 9/21/2026
market perspectives
September 14th 2026
Research Corner | 9/14/2026

market perspectives
September 8th 2026
August Review 2026
market perspectives
September 8th 2026
Research Corner | 9/8/2026
market perspectives
August 31st 2026
Research Corner | 8/31/2026
market perspectives
August 17th 2026
Research Corner | 8/17/2026
market perspectives
August 10th 2026
Research Corner 8/10/2026
market perspectives
August 7th 2026
July Review 2026
market perspectives
August 3rd 2026
Research Corner | 8/3/2026
market perspectives
July 27th 2026
Research Corner | 7/27/2026
market perspectives
July 20th 2026
Research Corner | 7/20/2026