
GEOPOLITICAL SHOCK TO AI EUPHORIA: NAVIGATING A NARROW BULL MARKET
“When stock prices are rising, it’s called ‘momentum investing’; when they are falling, it’s called ‘panic’” – Nobel Prize Winner, Paul Krugman
Summary
- Q2-2026 was dominated by the de-escalation of the US-Iran war. This triggered a risk-on environment and easing energy prices.
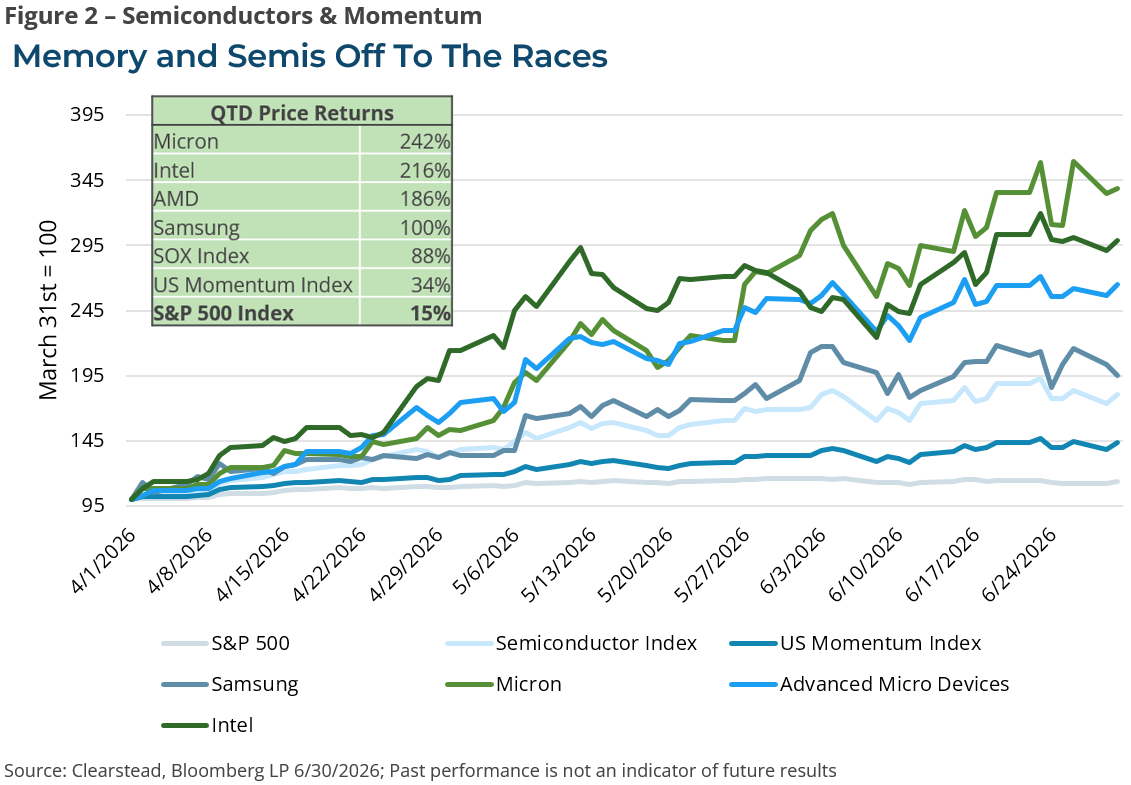
- While all equities gained from the shift in investor sentiment, global equity markets were increasingly led by a narrow group of mega-cap semiconductor and memory companies that are benefitting exponentially from the global AI-ecosystem build-out.
- US economic activity remained stable, and the labor market gained strength. However, inflationary pressures also increased during the quarter.
- The US consumer landscape continues to exhibit a K-shaped pattern, with higher income households driving the preponderance of spending. Widespread consumer angst is growing as inflation outpaces wage gains.
- Fixed-income markets were volatile in Q2, but most segments rose even as rates moved higher.
- Markets shifted from anticipating rate cuts in H2-2026 to anticipating at least one rate hike before year-end.
- The broader outlook for markets and the economy for H2-2026 remains positive but it is increasingly dependent on the continued AI-buildout, equity earnings upgrades, fixed income issuance, initial public offerings, and venture capital activity—in short, nearly everything.
Economy
Resilient Growth Amid Consumer Pessimism
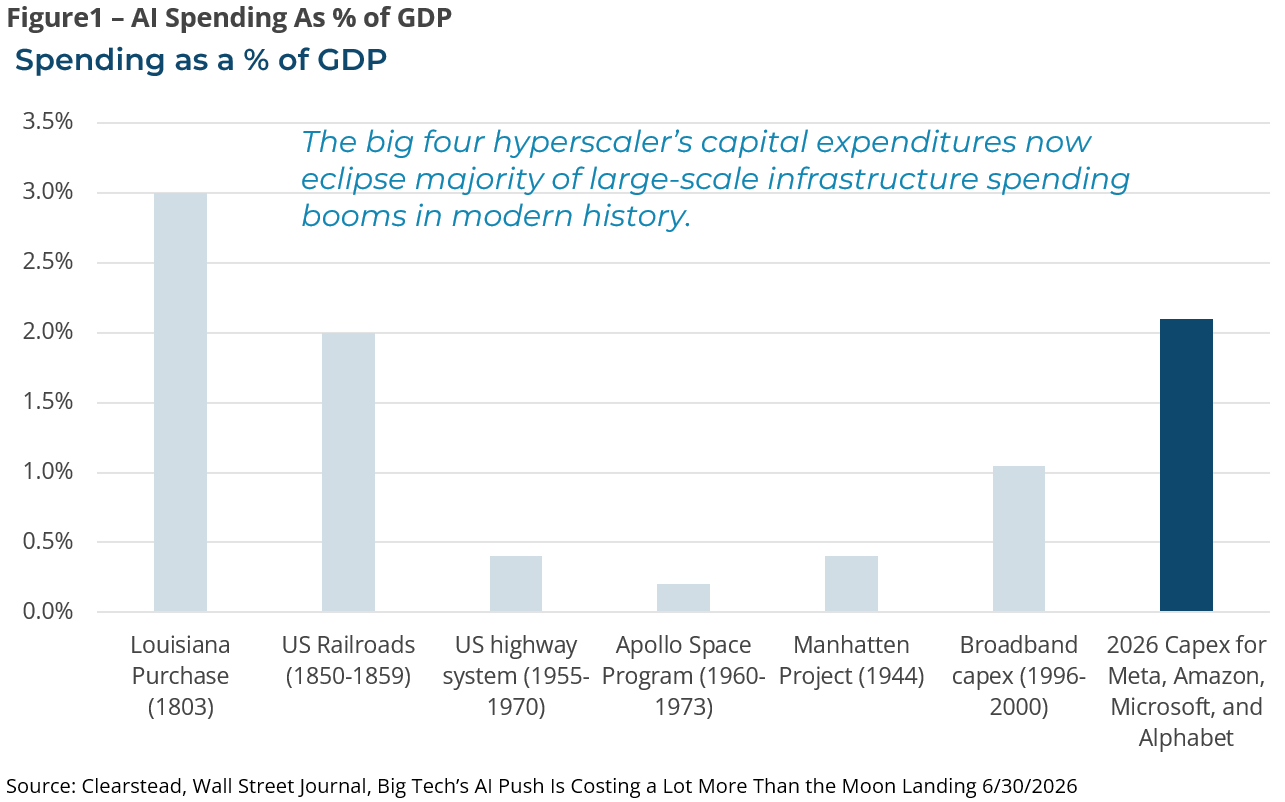
While financial and energy markets were dominated by news and the trajectory of the US-Iran conflict, the US economy was able to weather the geopolitical shock with only minimal negative impact. The US experienced real-GDP growth of 2.0% in Q1, and the consensus estimate for the US economy for Q2 is for the economy to expand by the same amount, 2.0%.1 Forward-looking gauges of economic activity such as Purchasing Manager surveys have moved higher in recent months, suggesting solid economic activity. However, central to the US economy is the capital expenditure spending of the major AI “hyperscalers”2—firms with massive cloud computing data centers that either directly or indirectly power the development and usage of AI models—which are on pace to spend nearly $700 billion dollars this year or about 2% of US GDP.1 This spending alone is likely to contribute to about half of all economic activity in 2026.
While the AI buildout has strengthened industrial activity, the US consumer is starting to show signs of pressure in the face higher oil prices, sticky inflationary pressures, and geopolitical uncertainty. Overall, the labor market remains stable, with no evidence of any meaningful pick-up in layoffs, and the unemployment rate remains low at 4.2%.1 The labor environment is providing support for the US consumer, but strains in this part of the economy are slowly accumulating. Consumer spending was revised lower in Q1 to only 0.5% (annualized rate) but seems to have picked up modestly in Q2.1
Nonetheless, K-shaped patterns continue to characterize the consumer landscape, with higher income households driving the preponderance of spending while lower-income households are increasingly stretched as inflation eats into their budgets. Various measures of broad consumer sentiment remain depressed, in large part because average hourly earnings—a decent proxy for average household income growth—grew at 3.5% year-over-year (YoY) whereas several inflation measures suggest prices increased by 4.0% YoY, thus leaving most workers worse off.1
Equity Markets
Risk-On Sentiment Emerges Alongside an AI-Momentum Trade
The quarter began with the US and Iran moving toward a fragile ceasefire that gradually began to provide the conditions for a gradual re-opening of the Strait of Hormuz and resumption of oil exports from the gulf states. As a result, oil prices eased steadily throughout the quarter as markets grew more confident that the US-Iran conflict would not re-escalate. This led to a nine-week rally in US stocks and strong returns across the US cap-spectrum. The two-month return of over 16% for the S&P 500 in April and May was in the top 1% of strongest two-month returns going back to 1946.1 While the S&P 500 reached twenty new record highs during the quarter, it was US small caps that made the strongest gains, with the Russell 2000 gaining over 21.5%.1 Except for Energy, every sector posted gains, led by Information Technology (+28.5%).1 Energy gave back 12% in Q2 as oil prices (West Texas Intermediate Crude or WTI) retreated, ending the quarter only about 6% higher than before the war began.1 Within the Technology sector, semiconductor and memory companies had an exceptional quarter, with the Philadelphia Semiconductor Index gaining over 80%.1 These gains were supported by a stellar Q1 earnings season, with corporate quarterly earnings per share growing by over 28% YoY.1 Full year 2026 S&P 500 earnings are expected to grow by over 20%, with strong positive earnings revisions for both the Technology and Energy sectors.1 Beneath the headline of U.S. market strength lies remarkably narrow leadership. Ten companies, all major beneficiaries of the AI infrastructure buildout, account for nearly 70% of the S&P 500’s return year-to-date. Excluding these ten stocks, the S&P 500 return falls from 10.2% to just 3.9% year-to-date, trailing broad international markets (MSCI ACWI ex USA) by over 9 percentage points.1
International markets also enjoyed a very strong Q2, led by emerging market equities (MSCI Emerging Markets Index) which gained over 24%.1 EM equities were buoyed by the strong gains stemming from Korea’s memory companies, Samsung and SK Hynix, which powered Korean equities (MSCI Korea Index) to rise more than 85% during the quarter.1 International developed equities (MSCI EAFE Index) gained over 10.8% during the quarter as the headwinds from spiking energy prices began to fade.1 The gains in international developed markets were strongest in Japan (Nikkei 225 +34%) as a weaker Yen provided a profit tailwind for Japan’s multinational and export-heavy industrial companies.1 Non-US equity returns would have been even stronger had the US dollar not strengthened during the quarter (a stronger dollar incrementally lowers returns for US-based investors).
Fixed Income Markets
A Volatile Quarter as Markets Now Anticipate a Rate Hike
Although interest rates rose across the yield curve in Q2, the short end of the curve rose the most (2-year US Treasury yield up 35 basis points [bps] versus only a 3-bps increase in yield for 30-year US Treasury bonds1), reflecting rising inflation concerns and an apparent shift in Federal Reserve monetary policy. When the year began, financial markets anticipated at least two or three cuts in the Fed Funds rate, and by the end of June, market expectations had shifted to pricing in rate hikes and a higher-for-longer interest rate environment.
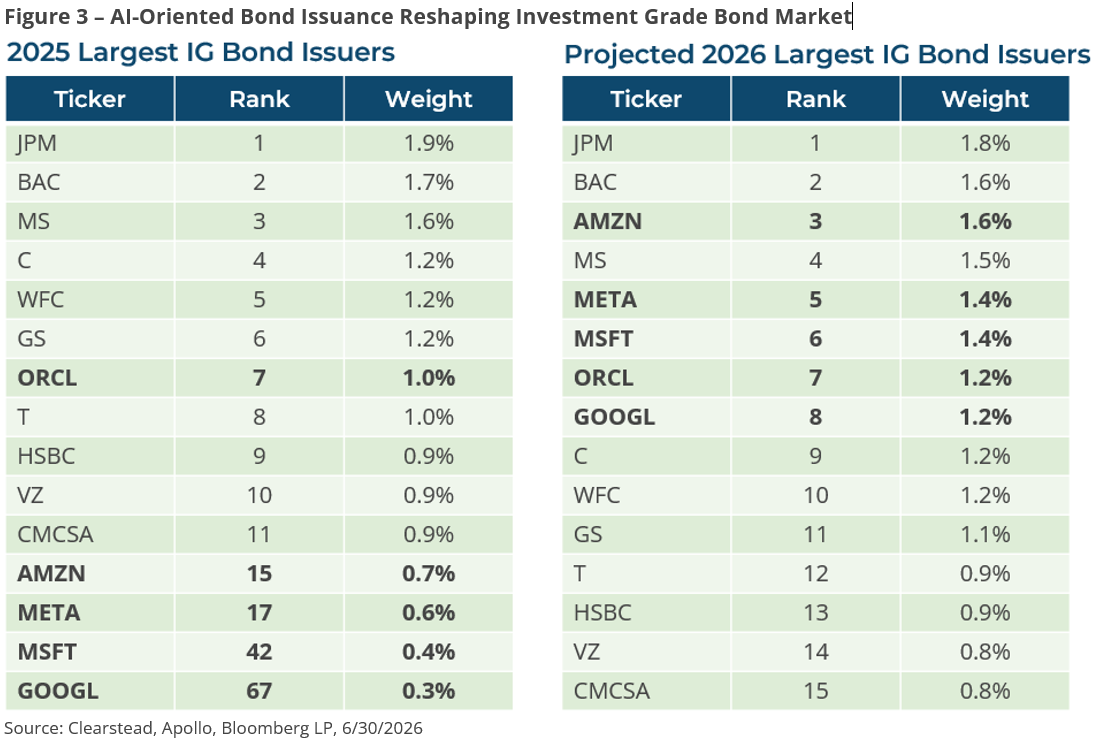
U.S. corporate bond issuance has surged in 2026, driven by heavy refinancing needs, M&A activity, and massive capital expenditures for artificial intelligence (AI) data centers. The largest single corporate bond issuances of 2026 have been overwhelmingly dominated by hyperscalers and mega-cap technology firms, reflecting the need to fund AI infrastructure and debt refinancing. SpaceX issued $25b, Meta $30b, Alphabet $52b, and Amazon $57bn1. The market has effectively and efficiently absorbed the record-breaking volume of U.S. corporate bond issuance so far. Despite supply tracking 21% higher year-over-year, demand from institutional investors has remained incredibly robust.3
The Bloomberg U.S. Aggregate Bond Index delivered modestly positive returns in the second quarter of 2026, as yields remained elevated even after geopolitical tensions in the Middle East began to ease. Sector performance was mixed: securitized assets and corporate bonds held up on resilient spreads, while Treasuries underperformed as the hawkish shift in Fed policy expectations drove yields broadly higher across the curve.
Summary & Outloook
As the negative effects of the US-Iran war fade, the base-case outlook for the U.S. economy and markets in 2026 remains cautiously optimistic. It is entirely possible that the S&P will grind higher in the coming quarters towards 8,000 price level. However, two important risks have crystalized: one is the centrality of the AI buildout to nearly everything, the other is the growing risk that the Fed will be compelled to hike rates to bring inflation down.
As to the first risk, the AI buildout could well prove to be a generational and transformative technology. Clearstead is generally optimistic that AI-driven productivity gains will materialize in the coming quarters and years, but it is equally possible that the companies and stocks that benefitted the most from this current buildout may not be the “winners” in the years to come. The narrowness of Q2’s gains and the fact that investors are increasingly using leverage to chase the returns bears close monitoring. In the same vein, given the centrality of AI to so many aspects of economy and markets, any retrenchment from the AI-buildout will have repercussions across fixed income markets, equities, and overall economic activity.
The second risk may be partially priced into current market dynamics as expectations for rate cuts have been supplanted by the expectation for at least one rate hike this year. Nonetheless, should inflation prove stubborn and should the combined impact of a super El Niño, lingering higher gasoline and fertilizer prices, tariff policies, and persistent housing costs push inflation incrementally higher in the coming months, the likelihood of Fed rate hikes could increase. This risk, while not our current baseline, could provide a catalyst for volatility.
Moreover, while investors should take solace in the strong corporate fundamentals and resilient US economy, the months preceding mid-term elections are typically choppy. Investor sentiment can swing abruptly as the thinning trading volumes of July and August give way to higher trading activity in September and October. More volatility may lie ahead, even if the path of equities is ultimately higher in the coming months.
As we have noted in past letters, the world is changing in structural ways: normalized (higher) interest rates, a growing trend towards fiscal dominance in monetary policy, regionalization over globalization, an emerging commodity super-cycle, and AI disruption. The surge in the stock prices of AI-buildout enablers—chips, memory, and select components—has sparked a large, global momentum trade. Clearstead generally advises against piling into assets that have seen frothy gains over short periods of time. Our approach is to ensure our clients’ asset allocation reflects their specific goals and objectives, while using market volatility as an opportunity to rebalance back to long-term targets. The benefits of a well-diversified portfolio have perhaps never been as important, as concentration increases within most major indices. The risks, big and small, continue to mount within today’s global markets.
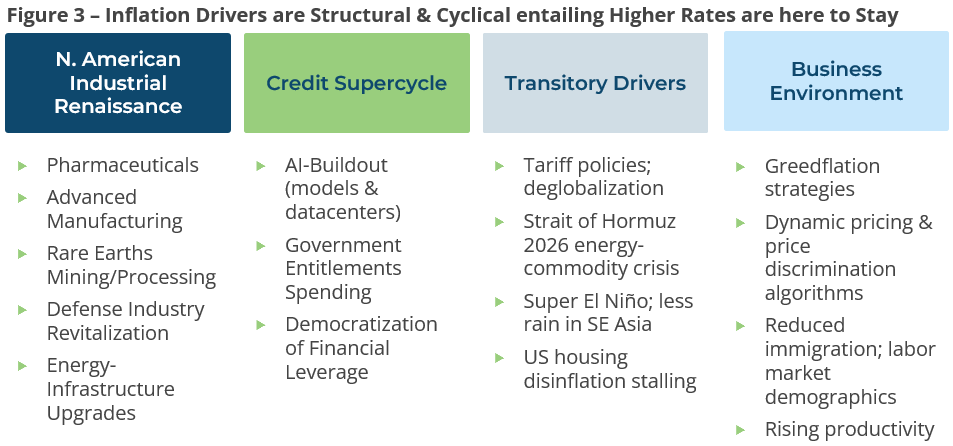
The end result is a higher for longer rate environment
Subscribe to our weekly Research Corner and other market commentary so you don’t miss our updates.
1 Bloomberg LP 6/30/2026
2 The top five global hyperscalers in the US are Amazon, Microsoft, Google, Oracle, and Meta
3 SIFMA 6/15/2026
DISCLOSURES
Information provided is general in nature, is provided for informational purposes only, and should not be construed as investment advice. These materials do not constitute an offer or recommendation to buy or sell securities. The views expressed by the author are based upon the data available at the time the article was written. Any such views are subject to change at any time based on market or other conditions. Clearstead disclaims any liability for any direct or incidental loss incurred by applying any of the information in this article. All investment decisions must be evaluated as to whether it is consistent with your investment objectives, risk tolerance, and financial situation. You should consult with an investment professional before making any investment decision. Performance data shown represents past performance. Past performance is not an indicator of future results. Current performance data may be lower or higher than the performance data presented. Performance data is represented by indices, which cannot be invested in directly.
Related or Tagged New Posts

market perspectives
September 28th 2026
Research Corner | 9/28/2026
market perspectives
September 21st 2026
Research Corner | 9/21/2026
market perspectives
September 14th 2026
Research Corner | 9/14/2026
market perspectives
September 8th 2026
August Review 2026
market perspectives
September 8th 2026
Research Corner | 9/8/2026
market perspectives
August 31st 2026
Research Corner | 8/31/2026
market perspectives
August 24th 2026
Research Corner |8/24/2026
market perspectives
August 17th 2026
Research Corner | 8/17/2026
market perspectives
August 10th 2026
Research Corner 8/10/2026
market perspectives
August 7th 2026
July Review 2026
market perspectives
August 3rd 2026
Research Corner | 8/3/2026
market perspectives
July 27th 2026
Research Corner | 7/27/2026