OBSERVATIONS
- Markets were mixed last week ahead of the 4th of July holiday. The S&P 500 gained 1.8% while small caps (Russell 2000) lost 0.4 % and the yield on the 10-year Treasury rose 11 basis points to 4.48%.1
- The S&P Cotality Case-Shiller US National Home Price Index edged up to 0.8% year-over-year (YoY) in April (latest available), up from March’s 0.7% YoY rate. While nominal home prices remained essentially flat due to elevated financing costs, sharp regional divergence continued with the Midwest and Northeast showing moderate growth while the Sunbelt and West saw declines.1
- The ISM Manufacturing PMI registered 53.3 in June, coming in below expectations (54.0) but marked the sixth consecutive month of expansion for the manufacturing sector.1
- The Job Openings and Labor Turnover Survey showed that job openings increased to a fresh two-year high of 7.6 million openings in May (latest available) and the number of quits—a proxy for worker confidence in the labor market—edged up to 3.065 million, which is slightly ahead of April’s 3.043 million.1
- Initial unemployment claims remain very low, registering only 215k new claims last week, which was a decrease of 1k from the week prior. Over the first 26 weeks of 2026, there were 5.7% fewer claims than last year and the lowest number of initial claims filed in the first half of the year since 1969.1
- The June employment report came in below expectations with only 57k new jobs created last month. Additionally, the jobs figures for both April (-31k) and May (-43k) were both revised lower. The unemployment rate fell to 4.2% in June down from May’s 4.3% rate.1
EXPECTATIONS
- The US declined to renew the USMCA—the trilateral trade agreement between the US, Canada, and Mexico—in its current form. The trade agreement will remain in effect for ten more years—given no members formally pull out—and begin a yearly cycle of mandatory reviews. The US is seeking stricter rules of origin within the North American auto sector, to limit the volume of Chinese imports to the region, and to loosen restrictions on US agricultural exports to Canada.1
ONE MORE THOUGHT: The June 2026 Russell Rebalance May Broaden US Equity Leadership1
The Russell Indexes’ semi-annual transition just delivered its first test, and the results read less like routine index maintenance and more like a referendum on twelve months of extraordinary equity market performance. FTSE Russell’s June 2026 reconstitution — effective at the market open on Monday, June 29 — moved total Russell 3000 market capitalization from $58.4 trillion to $75.6 trillion, a 29% expansion measured against the April 30 rank date. For context, that single-year gain in index value exceeds the entire market capitalization of most G7 economies’ public equity markets combined. The headline shift sits at the very top of the index. Nvidia displaced both Apple and Microsoft to become the largest constituent in the Russell 3000 and Russell 1000, while Alphabet climbed from fifth to second place. Apple and Microsoft were pushed down to third and fourth. It’s a meaningful change of the guard — the first time in over four decades that Apple and Microsoft haven’t occupied the top two spots between themselves. The concentration story has also intensified rather than abated as the ten largest constituents grew their combined market cap by 47.8%, to $26.4 trillion from $17.9 trillion a year ago. What’s more interesting is the breadth signal beneath the mega-cap reshuffle. The Russell 2000 (small cap stocks) returned 44.4% over the trailing year through April 30, outpacing the large-cap Russell 1000’s 30.4%, a reversal of the narrow, mega-cap-led tape that’s dominated since 2023. April 30th is the date of reference for the June rebalance. FTSE Russell’s own commentary framed this as improving market breadth beyond the Magnificent Seven, even as those seven names continued to compound, growing 49% over the period to a combined $22.4 trillion. Two things can be true at once: this reconstitution captured AI-driven mega-cap strength and a genuine small-cap rebound. The large/small-cap breakpoint itself confirms the magnitude of the move. The cutoff separating Russell 1000 from Russell 2000 membership rose 24% to roughly $5.7 billion, meaning a meaningful cohort of companies that would have graduated to large-cap status in a flatter year instead remained small cap simply because the bar moved higher alongside them. Sector-wise, the migration pattern is consistent with the cycle’s leadership. Technology and Industrials accounted for the largest share of new Russell 1000 entrants—eighteen additions apiece—with Healthcare, Communication Services, and Materials trailing well behind. That’s a vote for both the AI capex buildout and the broader industrial/reshoring theme. Perhaps the most structurally relevant change for investors is the style-index blurring. Apple and Microsoft shifted from exclusively Growth index constituents to top six holdings in both Growth and Value, while Amazon is expected to become the largest holding in the Russell 1000 Value Index — a name most investors still mentally file under “growth.” For portfolios that allocate separately to Growth and Value sleeves as a diversification mechanism, this reconstitution is a reminder that the lines have eroded considerably. Finally, this was also a structural first: the inaugural cycle of FTSE Russell’s move to semi-annual reconstitution, with a second rebalancing now scheduled for December — a change worth flagging for managing tracking error or planning trading around index events going forward. Notably, this marks a structural break from four decades of precedent: prior to 2026, the Russell Reconstitution occurred just once a year, every June, making this newly added December event the first-time investors have had to underwrite a second major rebalancing date on the calendar.
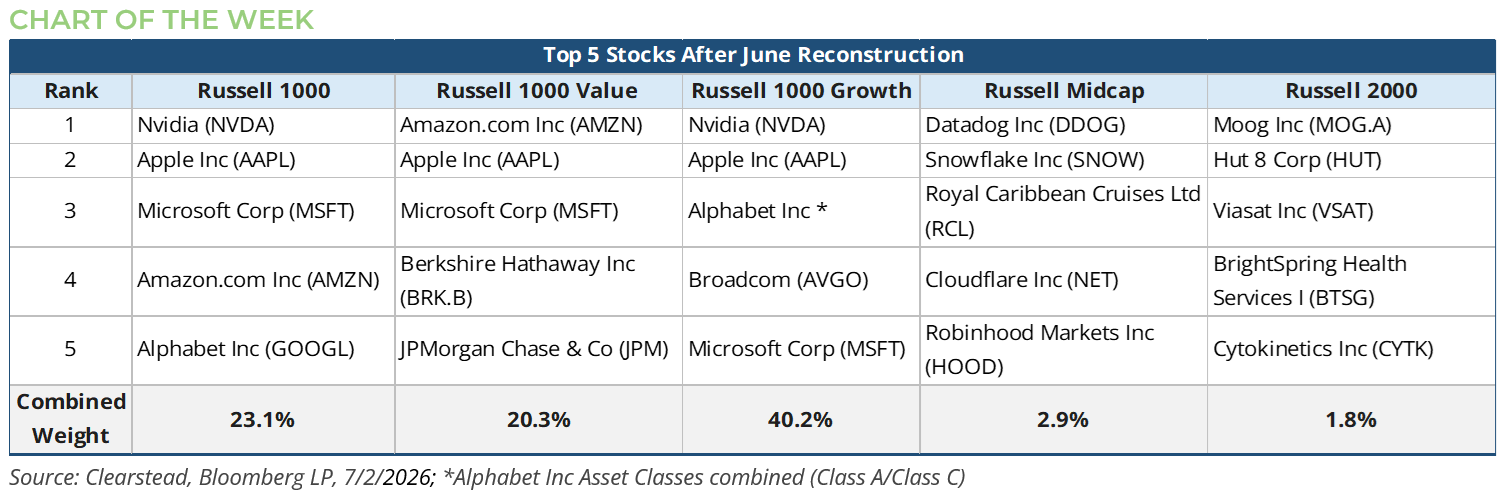

[1] Bloomberg LP, 7/2/2026
Information provided in this article is general in nature, is provided for informational purposes only, and should not be construed as investment advice. These materials do not constitute an offer or recommendation to buy or sell securities. The views expressed by the author are based upon the data available at the time the article was written. Any such views are subject to change at any time based on market or other conditions. Clearstead disclaims any liability for any direct or incidental loss incurred by applying any of the information in this article. All investment decisions must be evaluated as to whether it is consistent with your investment objectives, risk tolerance, and financial situation. You should consult with an investment professional before making any investment decision. Performance data shown represents past performance. Past performance is not an indicator of future results. Current performance data may be lower or higher than the performance data presented. Performance data is represented by indices, which cannot be invested in directly.
Related or Tagged New Posts

market perspectives
September 28th 2026
Research Corner | 9/28/2026
market perspectives
September 21st 2026
Research Corner | 9/21/2026
market perspectives
September 14th 2026
Research Corner | 9/14/2026

market perspectives
September 8th 2026
August Review 2026
market perspectives
September 8th 2026
Research Corner | 9/8/2026
market perspectives
August 31st 2026
Research Corner | 8/31/2026
market perspectives
August 24th 2026
Research Corner |8/24/2026
market perspectives
August 17th 2026
Research Corner | 8/17/2026
market perspectives
August 10th 2026
Research Corner 8/10/2026
market perspectives
August 7th 2026
July Review 2026
market perspectives
August 3rd 2026
Research Corner | 8/3/2026
market perspectives
July 27th 2026
Research Corner | 7/27/2026