OBSERVATIONS
- Markets were able to grind higher last week with the S&P 500 gaining 1.0% and small caps (Russell 2000) gaining 1.2%, while the yield on the 10-year Treasury fell 2 basis points to close at 4.46% in a trading week shortened by last Friday’s Juneteenth holiday.[1]
- Industrial production increased by 0.1% month-over-month (MoM) in May, which was slightly below expectations. The manufacturing subcomponent was flat in May.[1]
- The NAHB/Wells Fargo Housing Market Index fell 2 points to 35 in June, mostly due to home builders reporting weaker current sales conditions. The number of home builders cutting prices increased.[1]
- Housing starts fell more than 15% MoM to 1.177 million annualized in May—well below consensus expectations for more than 1.4 million starts—as higher interest rates weighed on activity. As compared with May 2025, housing starts were down almost 9% year-over-year (YoY).[1]
- Retail sales increased more than expected, rising 0.9% MoM in May. Retail sales excluding the volatile autos and gas categories rose 0.5% MoM, also ahead of expectations.[1]
- Initial unemployment claims remain low and fell by 4k last week to 226k. Compared to last year claims were 15,000 lower than in the same week in 2025.[1]
EXPECTATIONS
- The US and Iran signed a framework agreement last week to re-open the Strait of Hormuz and begin a 60-day period of negotiations—that can be extended if talks need more time—that will cover Iran’s nuclear program, the potential lifting of US sanctions, and cessation of hostilities between Israel and Hezbollah in Lebanon. The price of oil (WTI) declined to $75 a barrel as traders anticipate oil markets normalizing in the coming months and a resumption of pre-war oil tanker traffic through the Hormuz Strait.[1]
- Last week, the Bank of Japan raised its main policy rate by 25 basis points to 1.0%, a move that was widely anticipated by markets. This is the highest rate since 1995, and the bank signaled that it would continue its efforts to normalize monetary and may consider further gradual tightening every six to nine months.[1]
- The Fed, now under the direction of Chairman Kevin Warsh, chose to keep rates unchanged (3.5% to 3.75%) at its meeting last week. The Fed issued only a short statement that largely summarized current facts about the economy and avoided any language that would hint at subsequent policy moves. Markets, however, interpreted his press conference as hawkish and expect a 25-basis-point rate hike to be announced as early as the Fed’s late-October meeting.[1]
- In addition, the new Chair announced five task forces to re-examine the Fed’s core function and framework: 1) communications, 2) balance sheet, 3) inflation framework, 4) data sources, and 5) productivity growth. He indicated that these task forces may have draft recommendations ready for Fed debate by the fall and should largely conclude their work by year-end.[1]
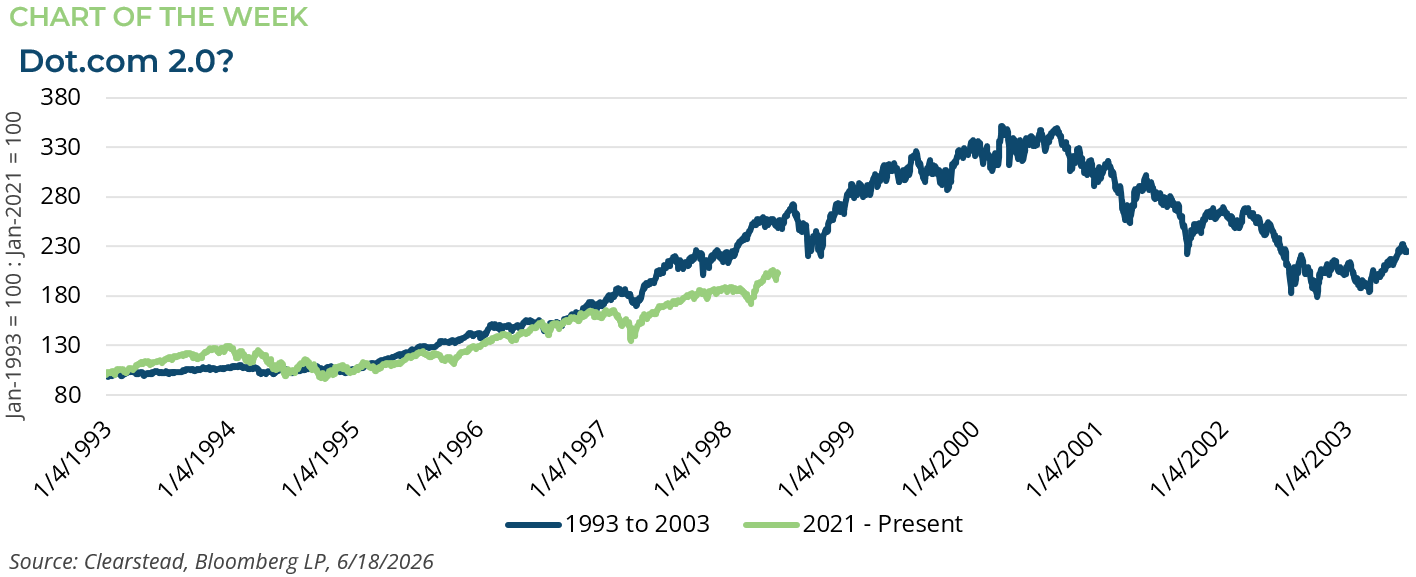
ONE MORE THOUGHT: If Current Market Dynamics Rhyme with the 1990s More Gains Could Lay Ahead[1]
Clients often ask whether today’s market dynamics can be informed by the market environment of the late 1990s. During that period, U.S. equities posted very strong gains in the back half of the decade as the emerging technologies of the internet and World Wide Web captured the imagination of households and businesses alike. Newer technology companies such as Microsoft, Oracle, and Cisco, along with telecommunications giants, drove significant gains in the S&P 500 and NASDAQ indices. In the mid-and late 1990s, these technology companies stole the spotlight, eclipsing many traditional industrial, energy, and financial firms in terms of earnings growth and market capitalization. As a result, from 1993 to its peak just over seven years later, the S&P 500 rose from roughly 400 to just above 1,500—a 3.7x increase. Over the past three years, AI-related stocks have similarly driven large gains in the S&P 500, taking the index from about 4,000 at the beginning of 2021 to more than 7,500 today, an increase of just under 1.9x in about five and a half years. If the current market were to mimic that of the 1990s, the S&P 500 might be expected to reach 8,000 in the coming quarters and then rise another 50% to 12,000, over roughly the next year and a half. There is undeniably strong positive momentum behind this year’s market gains, with much of the sentiment driven by actual earnings growth. In fact, the P/E multiple—the amount investors are willing to pay for future earnings—has fallen this year, suggesting that gains have been driven more by fundamentals than unfounded investor optimism. With the economy stable, geopolitical risks in the Middle East diminishing, and interest rates steady, markets are likely to refocus on company fundamentals—revenues, margins, and earnings—which could continue to improve over the coming quarters. This suggests that more gains may be ahead. However, we have also begun to see signs of rising leverage in financial markets as investors, both large and small, chase strong performance in AI and semiconductor stocks. The 1990s analogy offers a useful reminder: momentum can continue longer than expected, yet disciplined investors should remain alert to signs of exuberance and excess risk-taking as the cycle matures.

[1] Bloomberg LP, 6/18/2026
Information provided in this article is general in nature, is provided for informational purposes only, and should not be construed as investment advice. These materials do not constitute an offer or recommendation to buy or sell securities. The views expressed by the author are based upon the data available at the time the article was written. Any such views are subject to change at any time based on market or other conditions. Clearstead disclaims any liability for any direct or incidental loss incurred by applying any of the information in this article. All investment decisions must be evaluated as to whether it is consistent with your investment objectives, risk tolerance, and financial situation. You should consult with an investment professional before making any investment decision. Performance data shown represents past performance. Past performance is not an indicator of future results. Current performance data may be lower or higher than the performance data presented. Performance data is represented by indices, which cannot be invested in directly.
Related or Tagged New Posts

market perspectives
July 13th 2026
Research Corner | 7/13/2026

market perspectives
July 8th 2026
Quarterly Market Insights | 2Q26
market perspectives
July 6th 2026
Research Corner | 7/6/2026
market perspectives
June 29th 2026
Research Corner | 6/29/2026
market perspectives
June 15th 2026
Research Corner 6/15/2026
market perspectives
June 8th 2026
Research Corner 6/8/2026
market perspectives
June 1st 2026
Research Corner | 6/1/2026
market perspectives
May 26th 2026
Research Corner | 5/26/2026
market perspectives
May 18th 2026
Research Corner | 5/18/2026
market perspectives
May 11th 2026
Research Corner | 5/11/2026
market perspectives
May 4th 2026
Research Corner | 5/4/2026
market perspectives
April 27th 2026
Research Corner | 4/27/2026