
ROTATION, RESILIENCE, AND A HAWKISH TURN: NAVIGATING A HIGHER-RATE MARKET
“The history of interest rates is a history of inflation.” – Author Sidney Homer
Summary
- Q3-2026 was defined by a renewed flare-up in the US-Iran conflict, a sharp unwind of the AI-momentum trade in July, and a decisively hawkish turn in global monetary policy.
- Equity leadership broadened meaningfully with value, equal-weight, and cyclical sectors leading in the early weeks of the quarter, but rate-sensitive sectors came under pressure later in the quarter. Individual stock volatility increased markedly even as volatility in the S&P 500 index remained relatively muted.
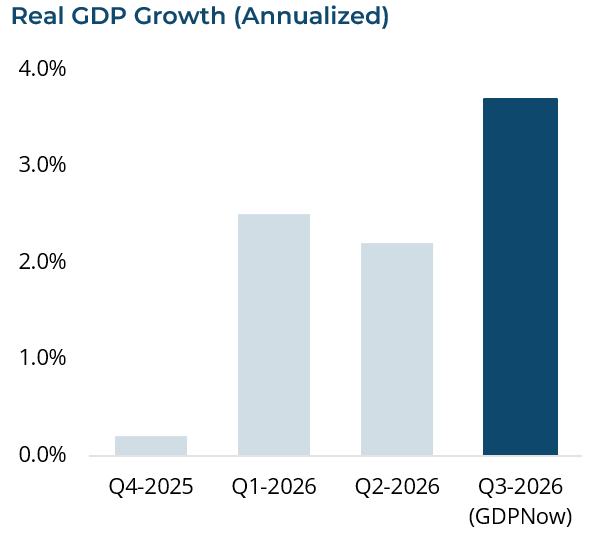
- The US economy re-accelerated, with the Atlanta Fed’s GDPNow model pointing to real growth of about 3.7% in Q3.1 The labor market remained stable, and initial unemployment claims remained at multi-decade lows.
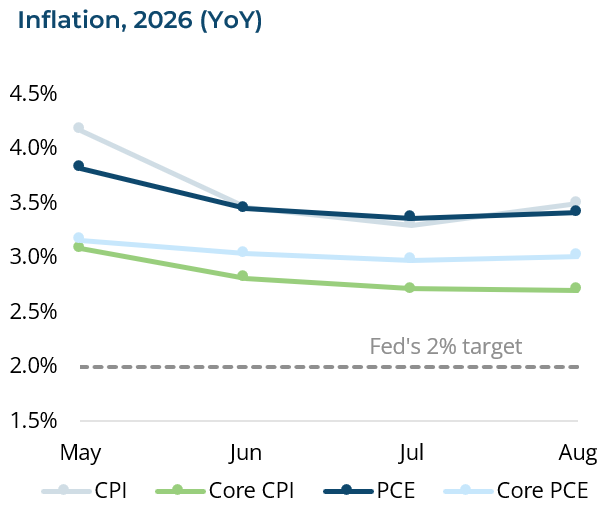
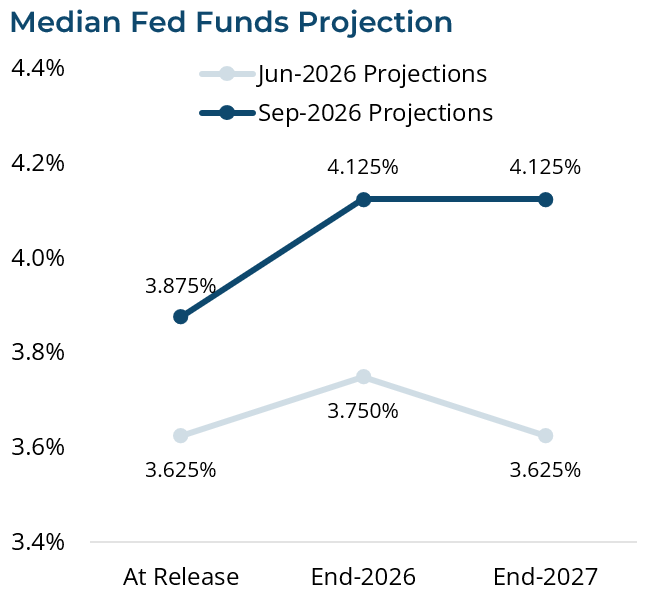
- Inflation proved stubborn. Headline CPI stalled at 3.4% year-over-year, energy prices climbed back toward their 2026 highs, and the Fed raised rates for the first time since July 2023.1 Markets are pricing at least one more rate hike this year.
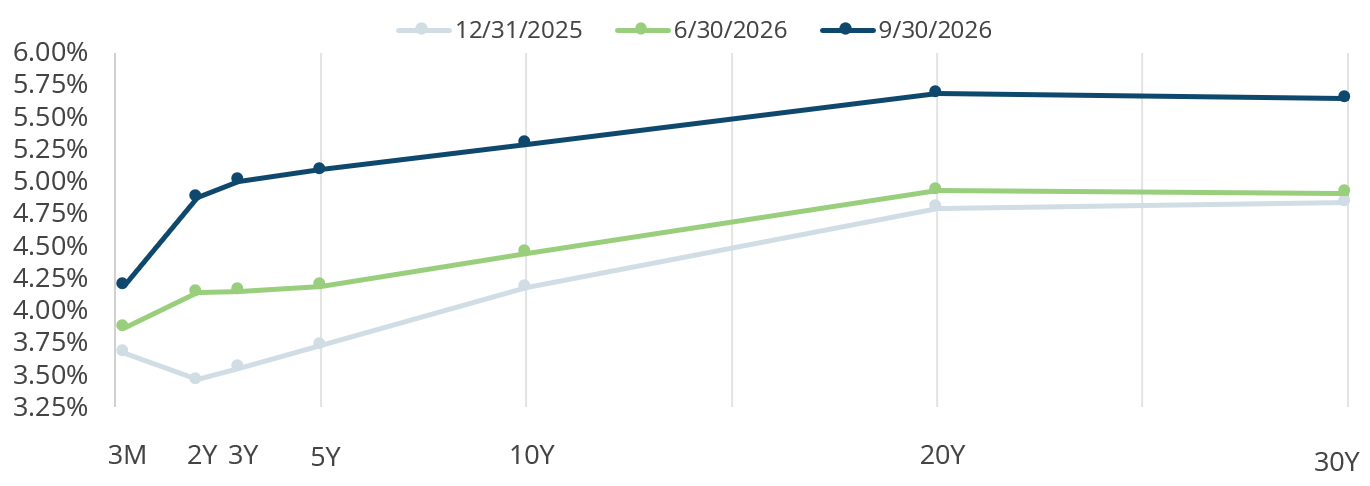
- Fixed-income markets were volatile as long-term yields pushed higher. The 10-year Treasury yield rose above 5.2%, and the 30-year yield reached its highest level since 2007.1
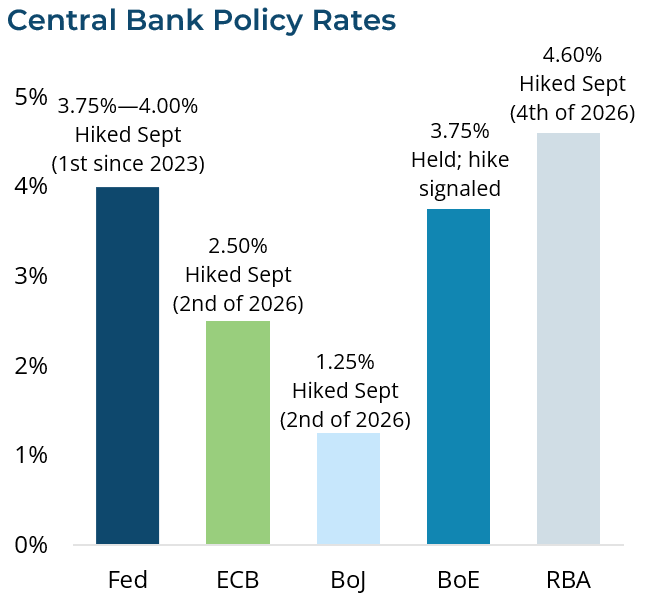
- A global central bank tightening cycle appears to be underway, with the Fed, the European Central Bank, the Reserve Bank of Australia, and the Bank of Japan all raising rates in September.
- The outlook for Q4 remains constructive given strong earnings and a resilient economy, but rising rates, record leverage, energy-market disruptions, and the November midterm elections argue for balance and discipline.
Economy
Growth Re-Accelerates as Inflation Refuses to Cool
The US economy entered the second half of the year on firmer footing than the headline figures suggested. The second estimate of Q2 real GDP growth was unchanged at a modest 1.5% (annualized rate), but real final sales to private domestic purchasera—a proxy for underlying household and business demand—was revised higher to a healthy 4.2%.1 That momentum carried into Q3. The ISM Manufacturing PMI jumped to 55.6 in July, its highest reading since May 2022, and remained firmly in expansion territory in August and September.1 The Atlanta Fed’s GDPNow model currently projects real growth of more than 3.7% for Q3. It is possible that the final estimate for Q3 moderates from this high level, but the AI-ecosystem capital spending boom remains a powerful tailwind for industrial activity.1
The labor market remains stable and is gradually gaining strength. It continues to reflect a “no hire, no fire” equilibrium. The unemployment rate has held at 4.1%, and weekly initial unemployment claims remain near multi-decade lows.1 Slower labor force growth and minimal net immigration have lowered the breakeven pace of job creation to roughly 50k per month, so modest payroll gains are not, by themselves, a sign of weakness.1
The central challenge remains inflation. Headline CPI eased from 4.2% YoY in May to 3.5% in June but has since stalled at 3.4%. The Fed’s preferred gauge, core PCE, has held at 3.3% YoY—well above the Fed’s 2% target.1 Renewed fighting between the US and Iran has pushed West Texas Intermediate (WTI) crude back above $100 per barrel and diesel to a record $6.49 per gallon, while an emerging “super” El Niño is lifting agricultural prices.1 With average hourly earnings growing at just 3.2% YoY, most workers are losing ground to inflation, and consumer sentiment remains depressed—the University of Michigan index fell to 48.1 in September and is just off year-to-date lows.1 Despite poor consumer sentiment, retail sales have held up in recent months—retail sales grew by 6.0% YoY in August—but household savings rates have fallen to multi-year lows.
Figure 1 – Growth Re-Accelerating, but Inflation Remains Sticky
Source: Clearstead, Bloomberg LP, BEA, BLS, Atlanta Fed, 9/18/2026; Q3-2026 GDP reflects the Atlanta Fed GDPNow estimate
Equity Markets
Rotation, Resilience, and a Reset of the AI-Momentum Trade
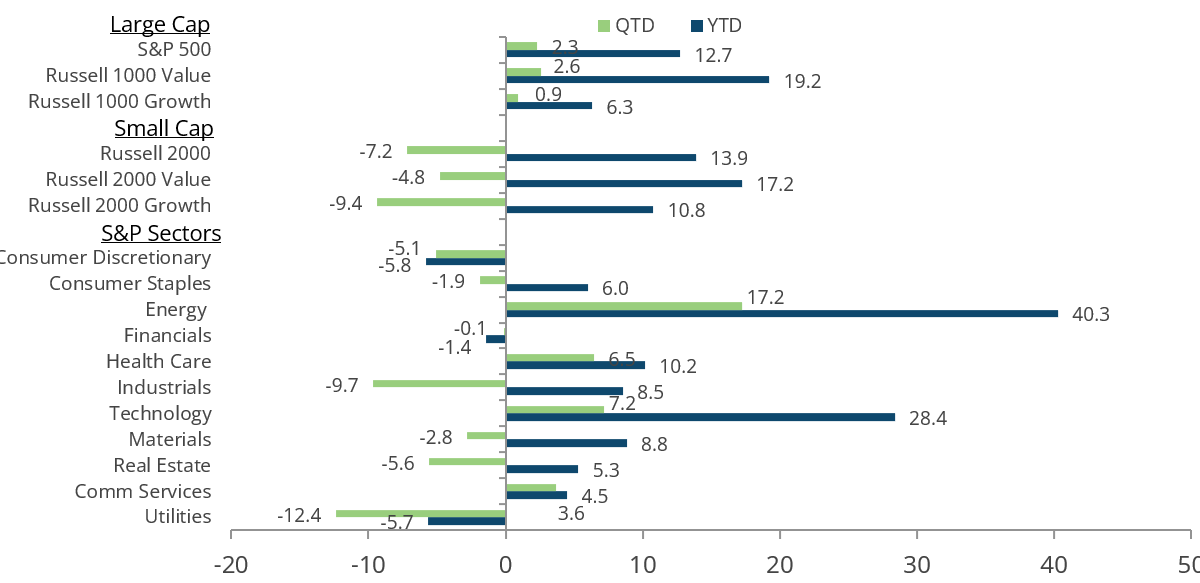
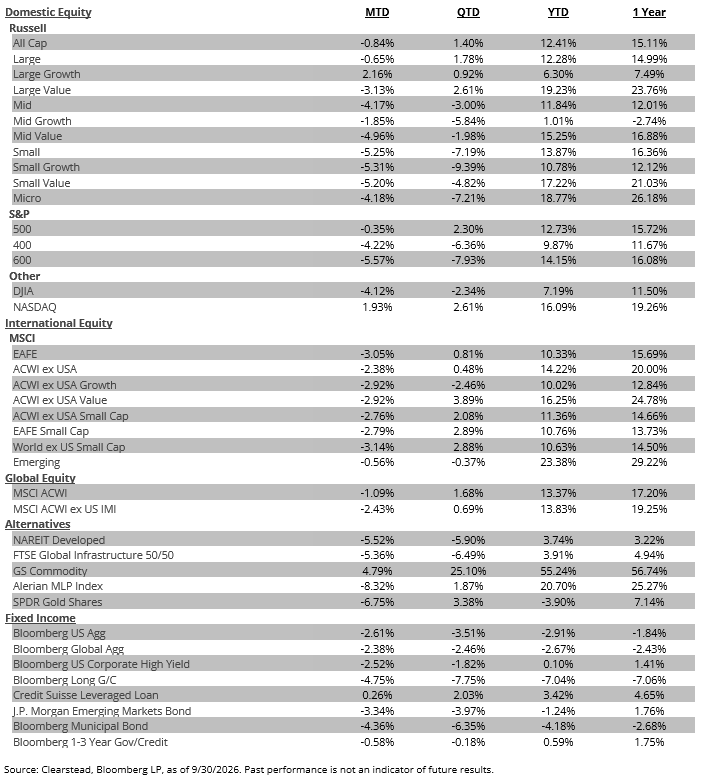
The S&P 500 gained 2.3% in Q3, but the path towards these solid returns was choppy. The quarter began with a sharp reversal of the narrow, AI-driven leadership that defined the first half of the year. As US-Iran fighting re-escalated, the momentum behind semiconductor and memory stocks unwound abruptly. The Philadelphia Semiconductor Index fell 28.6% from its June peak to its late-July low and ended about 12% lower for the quarter. The Nasdaq-100 also entered correction territory, a move amplified by a margin call on a heavily levered AI-focused hedge fund in July, but clawed its way back to finish the quarter approximately even.1 However, rather than retreating to cash amid this volatility, investors rotated into other parts of the market. Many software names—after sharp declines in H1-2026—made strong gains in the quarter, as did the Healthcare and Financials sectors. The Magnificent 7 stocks—Alphabet, Amazon, Apple, Meta, Microsoft, NVIDIA, and Tesla—which lagged in H1, made strong gains in Q3. Overall, the gains for Q3 were largely concentrated in US large caps, while more rate-sensitive portions of the market suffered declines amid steadily rising interest rates. For instance, US small caps (Russell 2000) and mid-caps (Russell Midcap) lost 7.2% and 3.0% in Q3, respectively. Meanwhile, more rate-sensitive sectors such as Real Estate and Utilities also declined for the quarter. In contrast, as oil prices moved higher in Q3 due to the re-escalation of the US-Iran conflict, the Energy sector (+17.2%) recorded the best returns of any S&P 500 sub-sector.
Figure 2 – Large Caps Make Gains; Small Caps See Declines
Source: Clearstead, Bloomberg LP 9/30/2026; Past performance is not an indicator of future results
International markets delivered mixed results in Q3. International developed equities (MSCI EAFE Index) gained roughly 0.8%, while emerging market equities (MSCI Emerging Markets Index), with their heavy exposure to the AI supply chain, were far more volatile, declining 0.4% during Q3.1 The Korean KOSPI Index, an emerging market stock index dominated by AI-oriented memory chip companies, lost more than a third of its value from its June record high to its low in late July as investors in Korean single-stock leveraged ETFs added to the index’s volatility in Q3. Ultimately, the KOSPI recovered and ended the quarter down about 8%.1 Unlike in the US, international small caps gained alongside their large cap peers, and real assets were a notable diversifier, with the S&P-GS Commodity Index up more than 17% in Q3 and gold rising nearly 4% amid a volatile quarter.1
Fixed Income Markets
Long-Term Yields Test New Highs as the Fed Resumes Hiking
Fixed-income markets faced a challenging third quarter as investors adjusted to a higher-for-longer interest rate environment. Strong economic growth, resilient labor markets, and persistent inflation increased expectations for monetary policy tightening and drove Treasury yields higher across much of the curve. Rising rates weighed on bond prices, resulting in broadly negative returns for interest rate-sensitive sectors.
Sector Performance Highlights
- U.S. Treasuries: The weakest-performing segment of the market as yields rose sharply amid stronger economic data, inflation concerns, and expectations for further central bank tightening. Longer-duration bonds experienced the greatest pressure.
- Investment-Grade Corporate Bonds: Delivered modestly negative returns but outperformed comparable Treasuries. Corporate fundamentals remained healthy, and credit spreads stayed relatively stable despite market volatility.
- High-Yield Bonds: One of the more resilient fixed-income sectors during the quarter. Stable spreads, solid earnings, and continued demand for income helped offset the impact of rising rates.
- Securitized Credit: Agency and non-agency mortgage-backed securities, along with asset-backed securities, benefited from attractive yields and strong underlying collateral performance. Results were generally better than government bonds but still affected by higher benchmark rates.
- Municipal Bonds: Held up comparatively well as supportive technical conditions and investor demand helped offset some of the headwinds from rising rates.
The rise in yields has meaningfully improved the opportunity set across fixed-income markets. Bonds now offer some of the most attractive income levels seen in years, creating a stronger foundation for future returns and providing a greater cushion against economic uncertainty. While inflation, monetary policy, and geopolitical developments remain important risks to monitor, we believe current valuations present compelling opportunities for long-term investors.
Figure 3 – Bear Steepening: Long-Term Yields Lead the Move Higher
Source: Clearstead, U.S. Dept. of the Treasury, 9/30/2026. Past performance is not an indicator of future results
Summary & Outlook
Heading into the final quarter of 2026, the base-case outlook for the U.S. economy and markets remains constructive. Corporate earnings are strong, the labor market is stable, and the AI buildout continues to support business investment and industrial activity. However, the market environment has grown more complex. Three risks have come into sharper focus: more inflationary pressure and rising interest rates, rising leverage and speculation in certain risk assets, and ongoing disruption in global energy markets.
As to the first risk, the Fed is not alone in making a hawkish turn. The European Central Bank raised its policy rate to 2.5% and the Bank of Japan raised its rate to 1.25%—the highest in 31 years—both delivering their second hike of 2026 in September. The Bank of England signaled that it may need to raise rates later this year.1 Equity markets are betting that companies can maintain margins and grow earnings despite a rising cost of capital. That bet looks reasonable in the near term, but it warrants close attention as the 10-year Treasury yield tests 5.3% and higher financing costs ripple through the housing market and highly levered borrowers.
The second risk is leverage. FINRA margin debt reached a record $1.5 trillion in June, up roughly 49% from a year earlier, and leveraged ETFs saw their strongest three-month inflows on record through July2 A steady stream of new products has made it easier than ever for investors to magnify returns. July’s swift unwind in semiconductor stocks and Korean equities was a reminder that leverage does not cause a market to turn, but can determine how quickly the turn is transmitted.
The third risk is energy. Renewed US-Iran fighting and disruptions to shipping through the Strait of Hormuz and the Red Sea have pushed WTI crude back toward its 2026 high of $112.95 per barrel.1 A durable ceasefire would provide meaningful relief for oil prices, but this looks unlikely in the near term. Record-high diesel prices have the potential to feed into pricing pressures for a broad set of goods and services. Lastly, the months preceding midterm elections have historically been choppy, and trade tensions with Canada and the ongoing USMCA review add to the current state of policy uncertainty.1
A strong corporate earnings outlook and continued AI-related investment have supported select equity-market leaders, but rising global yields are creating stronger competition for stocks and increasing the cost of capital. Several major central banks have adopted, or are considering, a tighter policy stance as they balance resilient growth against persistent inflation pressure. As the fourth quarter begins, investors will be watching whether earnings growth can broaden beyond a relatively small group of technology companies, whether inflation permits central banks to avoid additional tightening, and whether higher yields begin to weigh more meaningfully on economic activity. As market leadership and conditions evolve, diversified portfolios remain well positioned to capture returns from multiple sources rather than relying on any single theme or outcome.
Figure 4 – A Hawkish Shift: Global Central Banks Set to Tighten
Source: Clearstead, US Federal Reserve, European Central Bank, Bank of Japan, Bank of England, and Reserve Bank of Australia, 9/30/2026. Past performance is not an indicator of future results
Subscribe to our weekly Research Corner and other market commentary so you don’t miss our updates.
1 Bloomberg LP 9/30/2026
2 FINRA 8/21/202
a Real final sales to private domestic purchasers is the sum of consumer spending and private fixed investment; it excludes government spending, net exports, and inventories.
DISCLOSURES
Information provided is general in nature, is provided for informational purposes only, and should not be construed as investment advice. These materials do not constitute an offer or recommendation to buy or sell securities. The views expressed by the author are based upon the data available at the time the article was written. Any such views are subject to change at any time based on market or other conditions. Clearstead disclaims any liability for any direct or incidental loss incurred by applying any of the information in this article. All investment decisions must be evaluated as to whether it is consistent with your investment objectives, risk tolerance, and financial situation. You should consult with an investment professional before making any investment decision. Performance data shown represents past performance. Past performance is not an indicator of future results. Current performance data may be lower or higher than the performance data presented. Performance data is represented by indices, which cannot be invested in directly.
Related or Tagged New Posts

market perspectives
October 6th 2026
September Review 2026

market perspectives
October 5th 2026
Research Corner | 10/5/2026
market perspectives
September 28th 2026
Research Corner | 9/28/2026
market perspectives
September 21st 2026
Research Corner | 9/21/2026
market perspectives
September 14th 2026
Research Corner | 9/14/2026
market perspectives
September 8th 2026
August Review 2026
market perspectives
September 8th 2026
Research Corner | 9/8/2026
market perspectives
August 31st 2026
Research Corner | 8/31/2026
market perspectives
August 24th 2026
Research Corner |8/24/2026
market perspectives
August 17th 2026
Research Corner | 8/17/2026
market perspectives
August 10th 2026
Research Corner 8/10/2026
market perspectives
August 7th 2026
July Review 2026