OBSERVATIONS
- Markets traded close to flat last week with the S&P 500 losing 0.3%, while small caps (Russell 2000) lost 0.1%. Meanwhile, the yield on the 10-year Treasury rose 11 basis points to end the week at 5.27%.1
- The S&P Cotality Case-Shiller US National Home Price Index edged up to 1.9% year-over-year (YoY) in July (latest available), up from June’s 1.6% YoY growth.1
- The PCE Index, the Fed’s key inflation measure, fell to 3.4% YoY in August, down from July’s 3.7% YoY rate. Core-PCE, which removes the volatile food and energy categories, remained at 3.0% YoY in August, the same as in July’s 3.0% YoY rate. This PCE data was calculated using a revised methodology, which contributed marginally to the lower inflation figures.1
- Job postings declined in August (latest available) to about 7.1 million from July’s 7.2 million openings, while quits—a gauge of workers’ confidence in the job market—was largely unchanged in August at 3.1 million.1
- Initial unemployment claims remain low. Last week there were 197k new claims, a decrease of 1k from the week prior. Compared to the same week last year, there were 22k fewer claims.1
- In contrast, the September jobs numbers were weaker than expected with only 29k jobs created and the unemployment rate edging up to 4.2% from August’s 4.1% rate. In addition, both August and July’s job figures were revised lower by 31k and 29k, respectively.1
EXPECTATIONS
- In the wake of the recent inflation data, market expectations for a Fed rate hike in late October have fallen from nearly a 75% chance in the week prior to only about a 25% chance at the end of last week. Markets still expect, however, the Fed to hike rates by 25 basis points at their mid-December meeting.1
- Several states last week, including Texas, California, Ohio, Georgia, and Massachusetts, took steps to either temporarily suspend state-based gas taxes or allow for cheaper fuel blends to be sold in order to blunt the recent rises in fuel prices.1
ONE MORE THOUGHT: A Narrow Group of Mega-cap Names Disguised Wider Equity Weakness1
US large-cap equities were approximately flat in September (S&P 500 -0.3%), but the muted headline returns concealed weakness beneath the surface. The sharp rise in interest rates was the defining feature of financial markets in September. US Treasury yields moved higher across the curve, including a roughly 20-basis-point increase in the 10-year yield to 5.29% by month-end. Given this backdrop, the average stock in the S&P 500 fell over 4.5% in September, and nine of eleven sectors finished lower. Once again, the market’s gains were concentrated in Technology and the artificial intelligence theme. The Tech (+4.5%) and Comm. Services (+4.3%) sectors saw strong gains in September, while all the remaining sub-sectors lost ground. Unsurprisingly, the breadth of market leadership was very narrow—the equal-weighted S&P 500 lost 4.8%, while small (Russell 2000) and mid-caps (Russell Midcap) lost 5.3% and 4.2%, respectively. Close to 80% of the S&P 500 declined in September, but five mega-cap tech stocks—Meta, AMD, Apple, NVIDIA, and Intel—collectively added 1.7% and offset widespread declines in the remainder of the index. The largest decliners in September were cyclicals (Financials -7.2% and Materials -6.7%) and those sectors that have traditionally been most sensitive to higher interest rates such as Real Estate (-6.1%) and Utilities (-5.9%). Meanwhile, many software companies—which have been languishing this year—saw a strong rebound in September as some fears that the AI-disruption to the software sector may have been overdone. International markets also had negative returns in September with the tech-light MSCI EAFE (developed markets) losing 3.0%, while the tech-heavy emerging markets (MSCI EM Index) lost 0.6%. Emerging market equities generally benefited from strong rebounds in Korean (MSCI Korea +1.3%) and Taiwanese equities (MSCI Taiwan +3.9%), which are dominated by AI-oriented companies. Despite a benign summit between President Xi and President Trump that may pave the way for better future trade relations between the two countries, Chinese equities (MSCI China) gave back 4.6% in September. Meanwhile, Indian equities (MSCI India), which are sensitive to the rise in energy prices, declined by 6.3%. September’s market action highlighted an increasingly important tension for investors. Corporate earnings and continued AI-related investment have supported select equity-market leaders, but rising global yields are creating stronger competition for stocks and increasing the cost of capital. Several major central banks have adopted, or are considering, a tighter policy stance as they balance resilient growth against persistent inflation pressure. As the fourth quarter begins, investors will be watching whether earnings growth can broaden beyond a relatively small group of technology companies, whether inflation permits central banks to avoid additional tightening, and whether higher yields begin to weigh more meaningfully on economic activity. As market leadership and conditions evolve, diversified portfolios remain well positioned to capture returns from multiple sources rather than relying on any single theme or outcome.
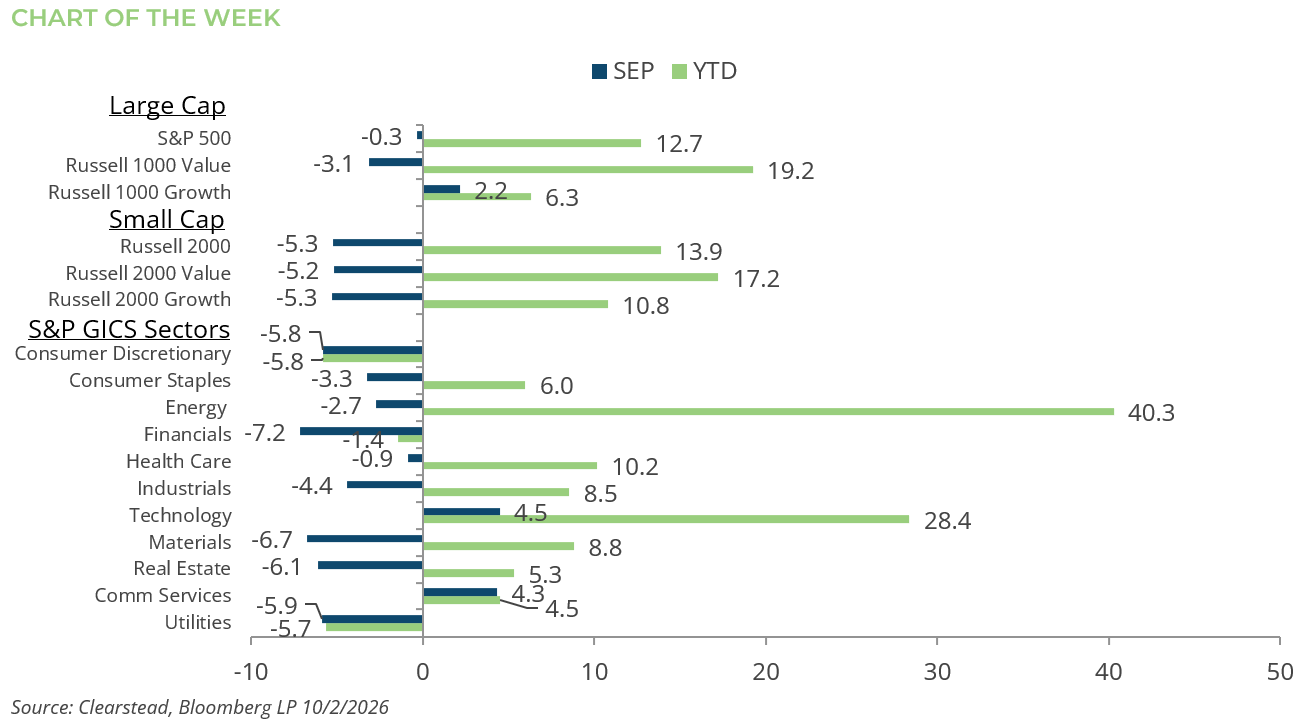

[1] Bloomberg LP, 10/2/2026
Information provided in this article is general in nature, is provided for informational purposes only, and should not be construed as investment advice. These materials do not constitute an offer or recommendation to buy or sell securities. The views expressed by the author are based upon the data available at the time the article was written. Any such views are subject to change at any time based on market or other conditions. Clearstead disclaims any liability for any direct or incidental loss incurred by applying any of the information in this article. All investment decisions must be evaluated as to whether it is consistent with your investment objectives, risk tolerance, and financial situation. You should consult with an investment professional before making any investment decision. Performance data shown represents past performance. Past performance is not an indicator of future results. Current performance data may be lower or higher than the performance data presented. Performance data is represented by indices, which cannot be invested in directly.
Related or Tagged New Posts

market perspectives
September 28th 2026
Research Corner | 9/28/2026
market perspectives
September 21st 2026
Research Corner | 9/21/2026
market perspectives
September 14th 2026
Research Corner | 9/14/2026

market perspectives
September 8th 2026
August Review 2026
market perspectives
September 8th 2026
Research Corner | 9/8/2026
market perspectives
August 31st 2026
Research Corner | 8/31/2026
market perspectives
August 24th 2026
Research Corner |8/24/2026
market perspectives
August 17th 2026
Research Corner | 8/17/2026
market perspectives
August 10th 2026
Research Corner 8/10/2026
market perspectives
August 7th 2026
July Review 2026
market perspectives
August 3rd 2026
Research Corner | 8/3/2026
market perspectives
July 27th 2026
Research Corner | 7/27/2026