OBSERVATIONS
- Markets traded lower last week amid rising interest rates and intensified fighting between the US and Iran. The S&P 500 lost 0.8%, while small caps (Russell 2000) lost 2.4%. The yield on the 10-year Treasury rose 19 basis points to end the week at 4.97%—the 10-year Treasury’s highest close this year.1
- Small business optimism dipped in August to 98.7 from July’s 99.8 but remains above its long-run average (98). Uncertainty increased in August as many business owners cited challenges with weakening sales, supply chain disruptions, and inflationary pressures.1
- Existing home sales declined in August to 3.98 million (annualized rate), which were down 2% month-over-month (MoM) from July’s sales rate (4.06 million) amid rising mortgage rates. 1
- Initial unemployment claims remain very low and decreased last week by 1k to 206k. There were over 28k fewer claims compared to the same week last year, but a similar number of claims for the corresponding weeks in 2024 and 2023.1
- Prices at the wholesale level came in largely in line with expectations. Headline PPI registered 5.4% year-over-year (YoY) in August. Core PPI, which removes volatile food and energy components, was 4.6% YoY in August, which was higher than July’s 4.3% YoY rate. 1
- Headline CPI and core-CPI—which removes the volatile food and energy categories—came in as expected, at 3.4% YoY and 2.4% YoY respectively, but were largely unchanged from July’s figures and remain elevated. Meanwhile the UofM consumer sentiment indicator declined in September amid rising gas prices.1
EXPECTATIONS
- The European Central Bank (ECB) raised its main policy rate last week by 25 basis points to 2.5% citing upside risks to inflation amid rising global energy costs.1
- The Federal Reserve meets next week to review interest rate policy. In the aftermath of Fed Chairman Warsh’s hawkish speech as well as the recent inflation figures, the Fed Fund Futures market has priced in a nearly 90% chance that the Fed hikes interest rates by 25 basis points this Wednesday.1
ONE MORE THOUGHT: The Developing “Super” El Niño Is Moving Prices1
Most investors rightly focus on earnings, interest rates, and fiscal policy when assessing the outlook for economic growth. However, an emerging “super” El Niño may become an important macroeconomic variable over the next 12 to 18 months. El Niño is a naturally occurring climate pattern characterized by unusually warm sea surface temperatures in the central and eastern equatorial Pacific Ocean. While a typical El Niño can alter weather patterns across the globe, a “super” El Niño refers to an exceptionally strong event, often associated with sea surface temperatures more than 2°C above normal levels. According to recent forecasts from the World Meteorological Organization (WMO), the current episode has a very high probability of strengthening into a very strong event during late 2026 and early 2027. The last super El Nino took place in 2015-2016, impacting more than 60mn people globally and triggering substantial humanitarian assistance needs. Before that, super El Nino events were recorded in 1997-1998 and 1982-1983. For investors, the significance of a super El Niño lies less in the weather itself and more in its potential economic impact. Research published by the International Monetary Fund (IMF) found that El Niño events can influence both economic growth and inflation through their impact on agricultural production, energy markets, and global commodity prices. The IMF’s analysis concluded that many countries experience higher inflation following El Niño shocks as food and non-fuel-related commodity prices rise. Agriculture is typically the first transmission channel. Historically, El Niño has been associated with drought conditions across parts of Southeast Asia, India, Australia, and portions of Africa, while some areas of South America experience wetter-than-normal conditions. The Food and Agriculture Organization (FAO) notes that disruptions to rainfall and temperature patterns can threaten crop yields, livestock production, and food security across major agricultural regions. Analysts have identified cocoa, coffee, sugar, palm oil, and rice among the commodities most exposed to El Niño-related weather disruptions—many are already seeing prices move higher (see Chart of the Week). Cocoa and coffee production could face supply pressures from drought and heat stress, while sugar and oil markets may be affected by reduced production in Southeast Asia. Conversely, more favorable growing conditions in parts of Brazil and Argentina could support soybean and corn production. The broader concern is, of course, inflation. Allianz Research recently highlighted IMF estimates suggesting that a typical El Niño raises global food prices by roughly 5% within a year, with stronger episodes potentially having a larger effect. Higher food prices can have outsized economic consequences because they affect consumers directly and can also influence inflation expectations. In many emerging-market economies, food represents a substantially larger share of household spending than in developed markets. As a result, weather-related disruptions can slow consumption growth, pressure government budgets, and complicate central bank policy decisions. Importantly, a super El Niño is not necessarily bearish for global growth. On the other hand, some regions may benefit from improved agricultural conditions, while others experience production losses. Nevertheless, the combination of supply disruptions, food price volatility, and inflationary pressures introduces an additional layer of uncertainty for investors.
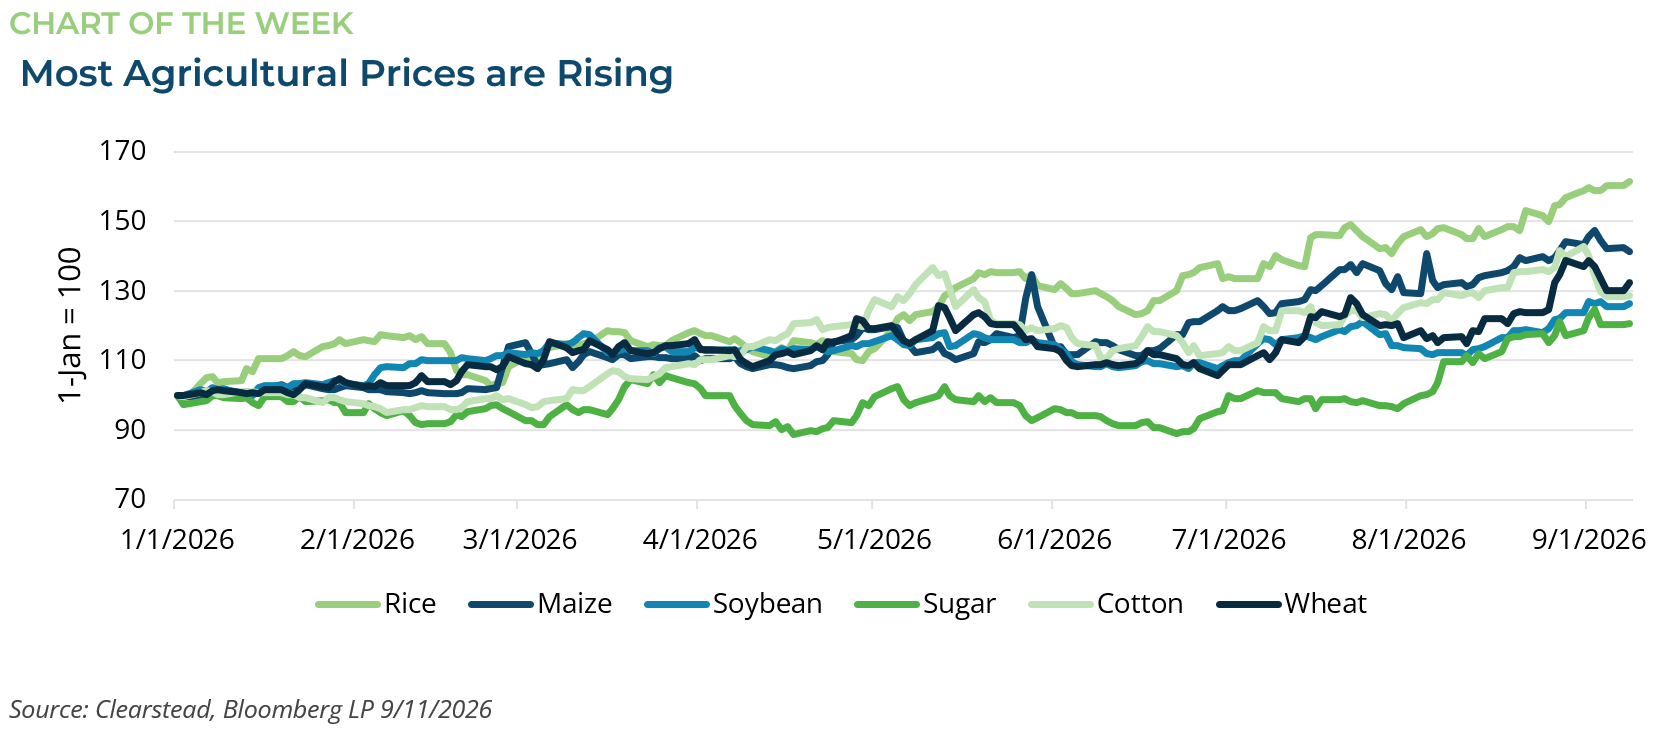

[1] Bloomberg LP, 9/11/2026
Information provided in this article is general in nature, is provided for informational purposes only, and should not be construed as investment advice. These materials do not constitute an offer or recommendation to buy or sell securities. The views expressed by the author are based upon the data available at the time the article was written. Any such views are subject to change at any time based on market or other conditions. Clearstead disclaims any liability for any direct or incidental loss incurred by applying any of the information in this article. All investment decisions must be evaluated as to whether it is consistent with your investment objectives, risk tolerance, and financial situation. You should consult with an investment professional before making any investment decision. Performance data shown represents past performance. Past performance is not an indicator of future results. Current performance data may be lower or higher than the performance data presented. Performance data is represented by indices, which cannot be invested in directly.
Related or Tagged New Posts

market perspectives
September 8th 2026
August Review 2026

market perspectives
September 8th 2026
Research Corner | 9/8/2026
market perspectives
August 31st 2026
Research Corner | 8/31/2026
market perspectives
August 24th 2026
Research Corner |8/24/2026
market perspectives
August 17th 2026
Research Corner | 8/17/2026
market perspectives
August 10th 2026
Research Corner 8/10/2026
market perspectives
August 7th 2026
July Review 2026
market perspectives
August 3rd 2026
Research Corner | 8/3/2026
market perspectives
July 27th 2026
Research Corner | 7/27/2026
market perspectives
July 20th 2026
Research Corner | 7/20/2026
market perspectives
July 13th 2026
Research Corner | 7/13/2026

market perspectives
July 8th 2026
Quarterly Market Insights | 2Q26