OBSERVATIONS
- Markets traded flat last week ahead of the Labor Day holiday with the S&P 500 gaining 0.1% and small caps gaining 0.2%, while the yield on the 10-year Treasury drifted higher by 6 basis points to end the week at 4.78%.1
- ISM Manufacturing PMI increased 2.3 points in August to 55.6, which is the highest reading since May-2022—any figure above 50 signals expanding sector activity—as there was broad strength across most subcomponents—hiring, new orders, and production.1
- ISM Services PMI also moved higher in August to 55.4 (July 54.1)—any figure above 50 signals expanding sector activity—driven by increases in current activity and new orders.1
- Durable goods orders increased by 1.1% month-over-month (MoM) in July. However, excluding the volatile transportation segment (autos and planes), durable goods orders rose only by 0.4% MoM.1
- Productivity rose by 1.4% during Q2, which was in line with expectations, while unit labor costs fell to 1.2% during the quarter—lower than Q1’s 1.3%, suggesting healthy productivity growth.1
- Job openings edged higher to 7.27 million in July (latest available) from June’s 7.18 million. However, the number of job quits fell to just over 3.0 million—down from 3.2 million in June—suggesting workers have less confidence in job switching.1
- Initial unemployment claims remain low but rose 3k from the week prior to 206k, which was in line with expectations. Compared to the same week last year, there were over 26k fewer claims.1
- The August jobs report was stronger than expected and showed that the economy created 162k new jobs, the unemployment rate remained at 4.1%, and the labor force participation rate ticked up to 61.6%. In addition, June and July’s jobs figures were revised higher to +31k and +21k, respectively.1
EXPECTATIONS
- The US House of Representatives passed the stop-gap spending bill that was passed by the Senate in mid-August that funds the government through early December. This averts any possible government shutdown prior to the midterm elections in November but will require the lame duck Congress to pass an additional spending bill before the December holidays to fully fund the remainder of the 2026-2027 fiscal year.1
- The Fed’s Beige Book—a qualitative assessment of the US economy—indicated that ten of the twelve Fed districts signaled slight to moderate economic growth in late summer, while two districts indicated no change in economic activity.1
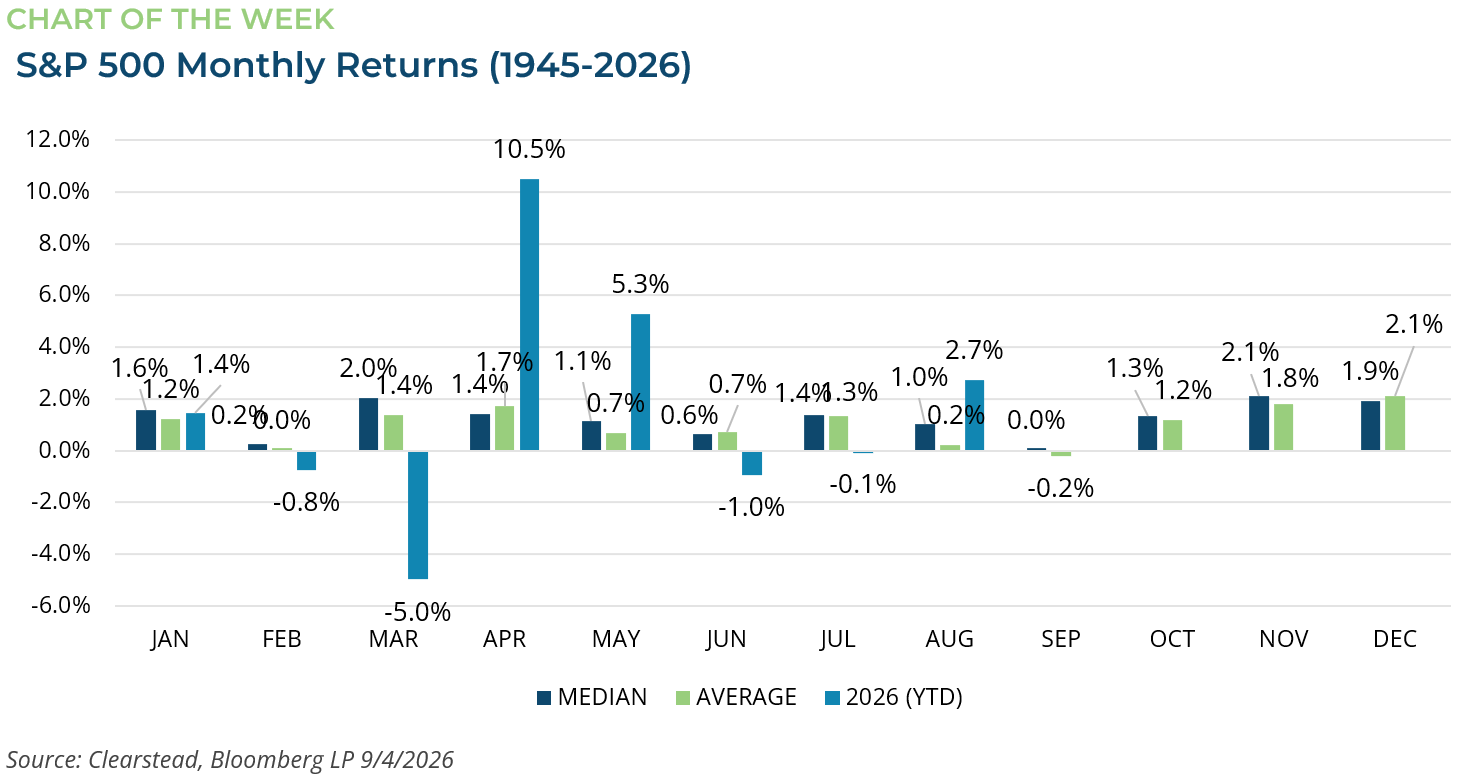
ONE MORE THOUGHT: Understanding Market Seasonality.1
Investors often hear the phrase “sell in May and go away,” a reference to one of the best-known examples of market seasonality. While no seasonal pattern is guaranteed to repeat, decades of market history across the S&P 500 and other major global indices suggest that certain periods of the year have tended to produce stronger or weaker returns than others. The S&P 500 has historically generated a disproportionate share of its long-term gains during the period from November through April. This trend has been observed over many decades and is often attributed to a combination of factors, including holiday spending, year-end portfolio positioning, and fiscal policy announcements. In contrast, the May through October period has typically delivered lower average returns and higher volatility, giving rise to the famous market adage. Since the mid-20th century, September has produced lower average returns than any other calendar month. However, when the S&P 500 was up strongly (>5%) through August, September produced slightly positive returns (0.2%, on average). Midterm election years tend to make the September-October danger zone even more pronounced but also tend to create some of the best buying opportunities of the four-year presidential cycle. October, while known for several historic market crashes, has generally been a more balanced month and has often marked important turning points. November and December have historically been among the strongest months for the S&P 500. December’s so-called “Santa Claus Rally” refers to the tendency for stocks to perform well during the last few trading days of the year and the first few sessions of January. January itself is often closely watched because of the “January Effect,” where smaller-cap stocks have historically outperformed as investors reinvest capital and reposition portfolios. However, investors should be cautious about relying too heavily on seasonal trends. Market performance is ultimately driven by economic growth, corporate earnings, interest rates, inflation, and geopolitical developments. There have been many years in which markets have significantly outperformed or underperformed historical seasonal averages. The most practical use of seasonality is just one input among many when evaluating market conditions. Successful long-term investing continues to depend more on maintaining disciplined investment process, diversification, and focus on fundamental drivers than attempting to time markets based solely on seasonal patterns.

[1] Bloomberg LP, 9/4/2026
Information provided in this article is general in nature, is provided for informational purposes only, and should not be construed as investment advice. These materials do not constitute an offer or recommendation to buy or sell securities. The views expressed by the author are based upon the data available at the time the article was written. Any such views are subject to change at any time based on market or other conditions. Clearstead disclaims any liability for any direct or incidental loss incurred by applying any of the information in this article. All investment decisions must be evaluated as to whether it is consistent with your investment objectives, risk tolerance, and financial situation. You should consult with an investment professional before making any investment decision. Performance data shown represents past performance. Past performance is not an indicator of future results. Current performance data may be lower or higher than the performance data presented. Performance data is represented by indices, which cannot be invested in directly.
Related or Tagged New Posts

market perspectives
August 31st 2026
Research Corner | 8/31/2026
market perspectives
August 24th 2026
Research Corner |8/24/2026
market perspectives
August 17th 2026
Research Corner | 8/17/2026
market perspectives
August 10th 2026
Research Corner 8/10/2026

market perspectives
August 7th 2026
July Review 2026
market perspectives
August 3rd 2026
Research Corner | 8/3/2026
market perspectives
July 27th 2026
Research Corner | 7/27/2026
market perspectives
July 20th 2026
Research Corner | 7/20/2026
market perspectives
July 13th 2026
Research Corner | 7/13/2026

market perspectives
July 8th 2026
Quarterly Market Insights | 2Q26
market perspectives
July 6th 2026
Research Corner | 7/6/2026
market perspectives
June 29th 2026
Research Corner | 6/29/2026